
Voronoi Diagrams
Loading the math board and drawing, please wait…
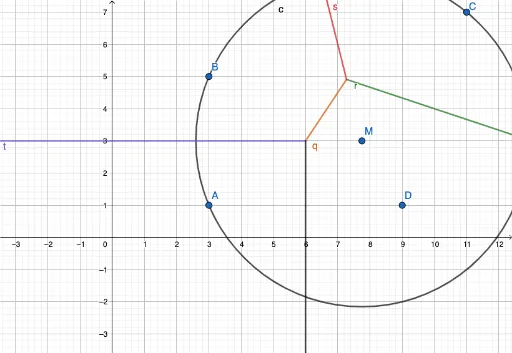
This example demonstrates the generation process of Voronoi diagrams. A Voronoi diagram is a partitioning of a plane into regions based on the distance to a specific set of points. Each region contains a given point and all points closer to that point than to any other. The core mathematical concepts involved include geometric construction, point set partitioning, and distance calculation. Using GeoGebra commands such as Circle, Segment, and Voronoi, the process of generating Voronoi diagrams can be visually demonstrated. Suitable for students at the junior high school level and above to learn geometric construction and spatial partitioning.
GeoGebra Commands & Parameters
Circle(A, B, C) → cSegment((6, -100), (6, 3)) → iVoronoi({A, B, C, D}) → graph1