
Voronoi Diagram Construction with 4 Points
Loading the math board and drawing, please wait…
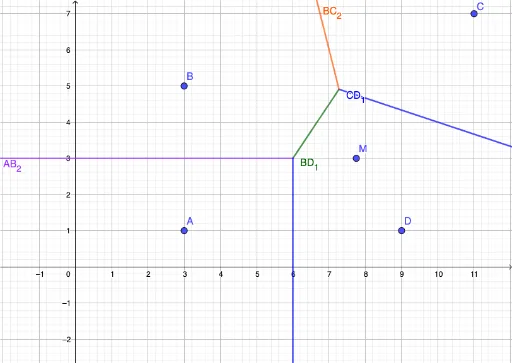
This example demonstrates how to construct a Voronoi diagram using four points, illustrating the division of regions based on proximity to each point. Key mathematical concepts include regional partitioning, statistical characteristics, set theory, algebra, and natural numbers. The construction utilizes GeoGebra commands and objects such as Circle and Segment, along with points A, B, C, D, and their connecting segments as summarized. It is suitable for high school mathematics instruction or as a geometric construction exercise to understand the basics of Voronoi diagrams.
GeoGebra Commands & Parameters
Circle(A, B, C) → cSegment((6, -100), (6, 3)) → AD_{1}
AI Drawing Prompt Reference
Draw a Voronoi diagram with four points A, B, C, and D. Start by plotting these four points. Then, draw four circles, each centered at one of the points with a large enough radius to cover all other points. Next, draw a line segment connecting point A and D. Finally, use the intersection points of these circles to determine the boundaries of the Voronoi regions.
The prompt above was compiled from the original drawing commands and is for reference only.