
Voronoi Diagram Test
Loading the math board and drawing, please wait…
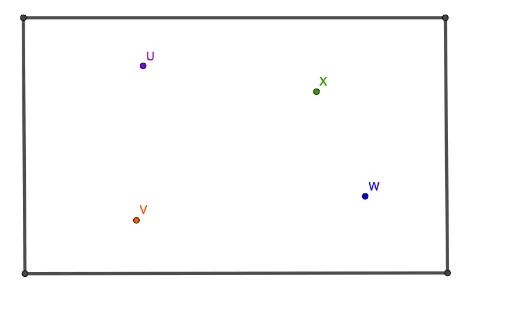
This example demonstrates the construction of a Voronoi diagram. A Voronoi diagram is a partitioning of a plane into regions based on distance to points in a specific subset of the plane. Each region contains a single point from the subset and all points in that region are closer to that point than to any other. The example involves key mathematical concepts such as geometric construction and distance to a line. Using GeoGebra commands like Line, Intersect, and Segment, the Voronoi diagram is constructed. Suitable for high school geometry education to help students understand the concept and construction of Voronoi diagrams.
GeoGebra Commands & Parameters
Line(A, B) → fLine(C, D) → gLine(E, F) → hLine(G, H) → iIntersect(f, h) → IIntersect(f, i) → JIntersect(g, i) → KIntersect(g, h) → LSegment(I, J) → jSegment(J, K) → kSegment(K, L) → lSegment(L, I) → mLine(M, N) → nLine(O, P) → pLine(Q, R) → qLine(S, T) → rIntersect(n, r) → UIntersect(n, q) → XIntersect(p, q) → WIntersect(p, r) → V
AI Drawing Prompt Reference
Draw a quadrilateral formed by four line segments, then draw two perpendicular line segments at the midpoints of these segments, connect the midpoints to form a new quadrilateral, and finally connect the vertices of these quadrilaterals with line segments to create a complex geometric pattern.
The prompt above was compiled from the original drawing commands and is for reference only.