
Voronoi Cones by Tom Walsh
Loading the math board and drawing, please wait…
In collections
Developing fun games and puzzles with 3D printing for STEAM
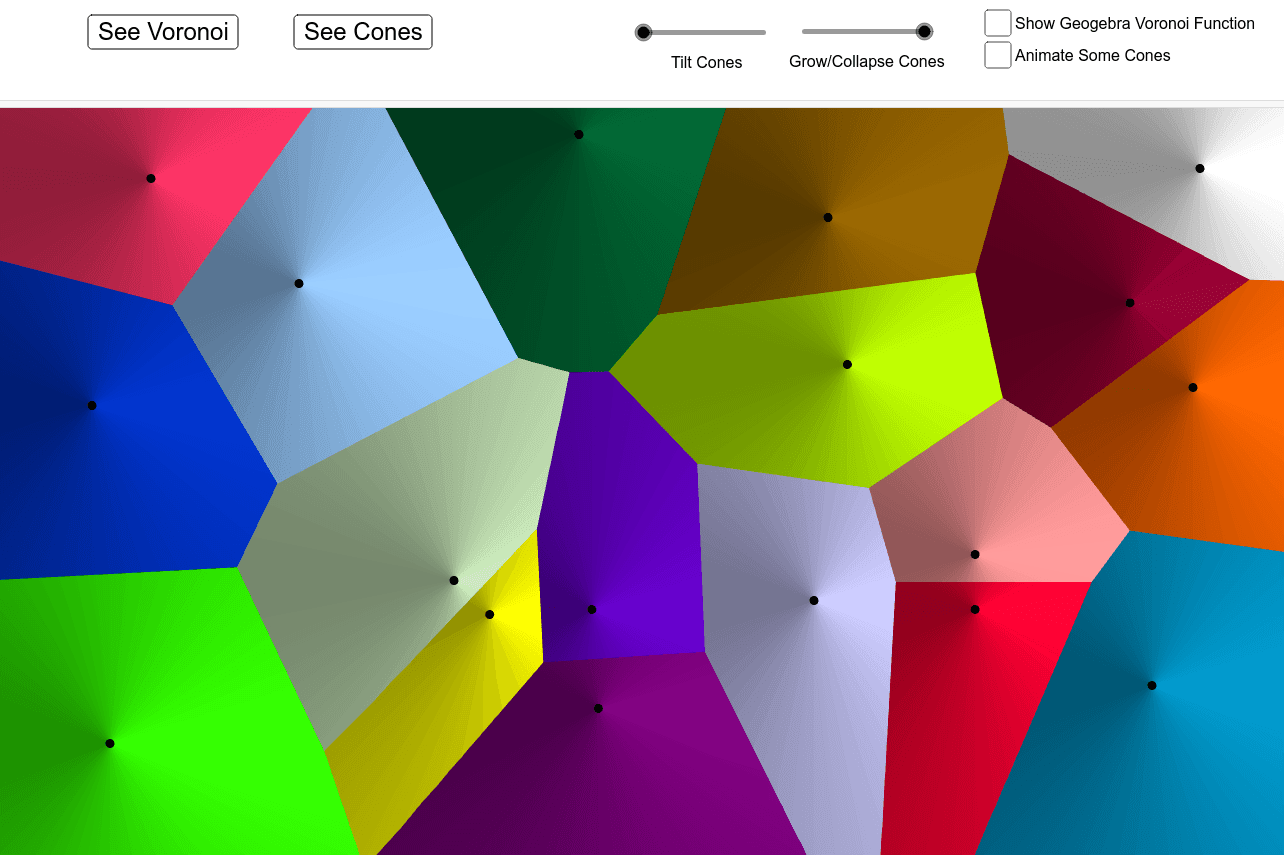
This GeoGebra example demonstrates the spatial arrangement and geometric relationships of multiple cones partitioned via Voronoi diagram principles. Core mathematical concepts include Voronoi diagrams, conical surfaces, tangent lines, right triangles, and algebraic region division. Construction uses the Cone and Voronoi commands with point sets A1–B1–C1 and similar, incorporating piecewise functions, tangent lines, and right triangle geometry. Suitable for high school spatial geometry, university analytic geometry, and mathematical modeling interest exploration.
GeoGebra Commands & Parameters
Cone((x(C2), y(C2), -5), C2, 5) → E2_1, F2_1, G2Cone((x(C2), y(C2), -5), C2, 5) → F2_2, G2_1, H2Cone((x(C3), y(C3), -5), C3, 5) → E3_1, F3_1, G3Cone((x(C3), y(C3), -5), C3, 5) → F3_2, G3_1, H3Voronoi(list1) → graph1Cone((x(C1), y(C1), (-c)), C1, c) → D1, E1, F1Cone((x(C2), y(C2), (-c)), C2, c) → D2, E2, F2Cone((x(C3), y(C3), (-c)), C3, c) → D3, E3, F3Cone((x(C4), y(C4), (-c)), C4, c) → D4, E4, F4Cone((x(C5), y(C5), (-c)), C5, c) → D5, E5, F5Cone((x(C6), y(C6), (-c)), C6, c) → D6, E6, F6Cone((x(C7), y(C7), (-c)), C7, c) → D7, E7, F7Cone((x(C8), y(C8), (-c)), C8, c) → D8, E8, F8Cone((x(C9), y(C9), (-c)), C9, c) → D9, E9, F9Cone((x(C10), y(C10), (-c)), C10, c) → D10, E10, F10Cone((x(C11), y(C11), (-c)), C11, c) → D11, E11, F11Cone((x(C12), y(C12), (-c)), C12, c) → D12, E12, F12Cone((x(C13), y(C13), (-c)), C13, c) → D13, E13, F13Cone((x(C14), y(C14), (-c)), C14, c) → D14, E14, F14Cone((x(C15), y(C15), (-c)), C15, c) → D15, E15, F15Cone((x(C16), y(C16), (-c)), C16, c) → D16, E16, F16Cone((x(C17), y(C17), (-c)), C17, c) → D17, E17, F17Cone((x(C18), y(C18), (-c)), C18, c) → D18, E18, F18
AI Drawing Prompt Reference
Draw a set of cones defined by multiple points, with their bases on the xOy plane and vertices on the z-axis at the same height. Then generate a Voronoi diagram using the vertices of these cones to show the boundaries between them.
The prompt above was compiled from the original drawing commands and is for reference only.