
Volume of a Cylinder with Fixed Surface Area
Loading the math board and drawing, please wait…
In collections
Surface and Volume Applets
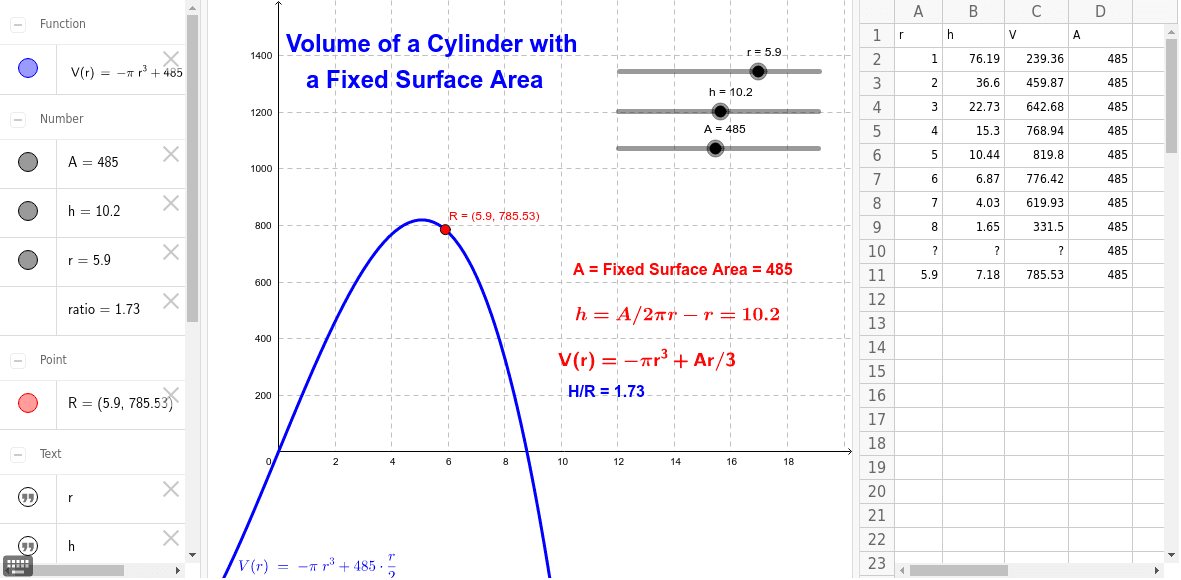
This example demonstrates the change in the volume of a cylinder under a fixed surface area condition. Key mathematical concepts include the formulas for the surface area and volume of a cylinder. By adjusting the height and radius of the cylinder, the relationship between the volume and the dimensions can be observed. The construction involves objects such as the radius, height, surface area, and volume of the cylinder. Suitable for high school mathematics education and learning.
GeoGebra Commands & Parameters
Numeric r(5.9)Numeric h(10.2)Numeric A(485.0)V(r) = ((-π) * r^(3)) + (A * r / 2)(r, V(r))Numeric A2(1.0)Numeric A3(2.0)Numeric A4(3.0)Numeric A5(4.0)Numeric A6(5.0)Numeric A7(6.0)Numeric A8(7.0)Numeric A9(8.0)ArA / (((2 * π) * A2)) - A2AAAAAAAAAA / (((2 * π) * A3)) - A3A / (((2 * π) * A4)) - A4A / (((2 * π) * A5)) - A5A / (((2 * π) * A6)) - A6A / (((2 * π) * A7)) - A7A / (((2 * π) * A8)) - A8A / (((2 * π) * A9)) - A9Numeric A10(NaN)A / (((2 * π) * A10)) - A10A / (((2 * π) * A11)) - A11((-π) * A2^(3)) + (D2 * A2 / 2)((-π) * A3^(3)) + (D3 * A3 / 2)((-π) * A4^(3)) + (D4 * A4 / 2)((-π) * A5^(3)) + (D5 * A5 / 2)((-π) * A6^(3)) + (D6 * A6 / 2)((-π) * A7^(3)) + (D7 * A7 / 2)((-π) * A8^(3)) + (D8 * A8 / 2)((-π) * A9^(3)) + (D9 * A9 / 2)((-π) * A10^(3)) + (D10 * A10 / 2)((-π) * A11^(3)) + (D11 * A11 / 2)h / r
AI Drawing Prompt Reference
Draw a cylinder graph showing the relationship between volume and surface area. Include key objects like radius, height, surface area, and volume. The construction order should be: first set radius and height, then calculate surface area and volume, and finally show the volume curve as radius changes. Ensure the graph is clear with key values labeled.
The prompt above was compiled from the original drawing commands and is for reference only.