
Volume by the Shell Method: Nested Cylinders Visualization
Loading the math board and drawing, please wait…
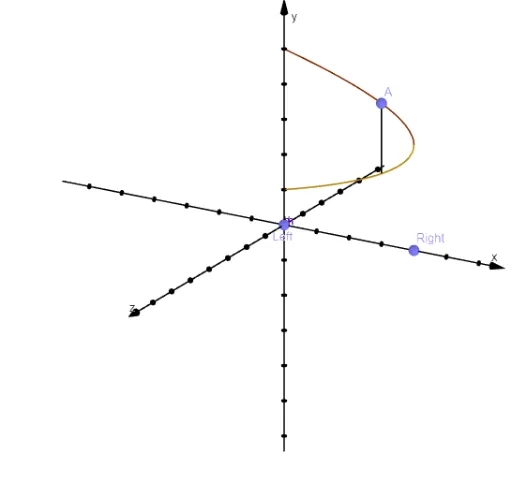
This example illustrates the shell method for computing the volume of a solid of revolution by representing it as a set of nested thin cylinders (shells). Visually, it shows how a region bounded by a curve over an interval rotates around a specified line, producing a volume that can be approximated by summing cylinder volumes whose radius and height vary with position, and then becomes exact in the limiting sense. Key concepts include volume of revolution, the shell method, variable radius/height geometry, interval endpoints (special points) selection, and linking the construction to a function graph. Construction details drawn from the GeoGebra commands include Point, Segment, and CurveCartesian to define critical points and the curve (e.g., objects corresponding to A, B, f, g, Left/Right, and related parameters); Surface to render the 3D solids/shell visualization; If to control conditional display or piecewise behavior; and Textfield plus LaTeX to label parameters and expressions (such as variables like h, α, β and a text label like text1). Suitable for advanced secondary education and early university calculus, especially when teaching or learning integral-based volume computation with strong geometric intuition.
GeoGebra Commands & Parameters
Point(xAxis) → LeftPoint(xAxis) → RightPoint(f) → ASegment(B, A) → aTextfield(g) → inputBox1Textfield(h) → inputBox2Segment((x(Left), g(x(Left))), (x(Left), h(x(Left)))) → jSegment((x(Right), g(x(Right))), (x(Right), h(x(Right)))) → lSurface((x(A) * cos((-t))), u, (x(A) * sin((-t))), t, 0, β, u, Min[y(A), y(B)], Max[y(A), y(B)]) → dIf(α > 0, Surface[(u * cos((-t))), g(u), (u * sin((-t))), t, 0, α, u, x(Left), x(Right)]) → eSurface((u * cos((-t))), k(u), (u * sin((-t))), t, 0, α, u, x(Left), x(Right)) → iSurface((x(Left) * cos((-t))), u, (x(Left) * sin((-t))), t, 0, α, u, Min[g(x(Left)), h(x(Left))], Max[g(x(Left)), h(x(Left))]) → mSurface((x(Right) * cos((-t))), u, (x(Right) * sin((-t))), t, 0, α, u, Min[g(x(Right)), h(x(Right))], Max[g(x(Right)), h(x(Right))]) → nCurveCartesian((x(A) * cos((-t))), y(A), (x(A) * sin((-t))), t, 0, α) → bCurveCartesian((x(A) * cos((-t))), y(B), (x(A) * sin((-t))), t, 0, α) → cLaTeX((((("\text{V}=2\pi\int_{x_{\text{Left}}}^{x_{\text{Right}}}x\left[\left(" * g) * "\right)-\left(") * h) * "\right)\right] dx")) → text1
AI Drawing Prompt Reference
Create a 3D visualization for the shell method of a solid of revolution using nested thin cylinders. Choose left and right x-boundary points for an interval, and in a vertical cross-section define two bounding graphs whose values determine, at each x, the cylinder’s radius and its height difference. Rotate the family of thin cylindrical shells around the specified axis by sweeping the angle parameter t from 0 to the chosen angle α, forming the corresponding ruled surface(s). Show representative curves on the boundary at the left and right endpoints, and render the overall shell surfaces with heights taken between the two functions. Add a labeled text equation for the volume integral of the form 2π∫ from left to right of x·(g(x)−h(x)) dx.
The prompt above was compiled from the original drawing commands and is for reference only.