
Volume by Cross Section Visualization
Loading the math board and drawing, please wait…
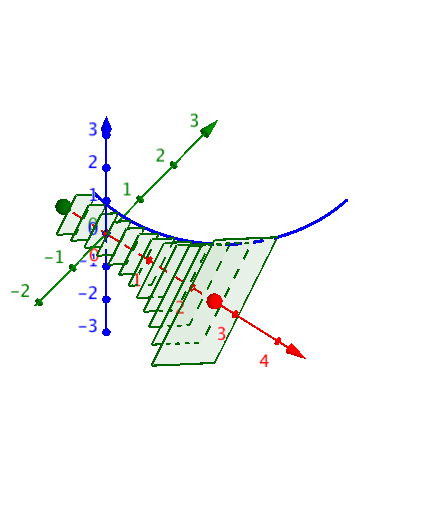
Created to help calculus students visualize volume by cross-section. Users can choose the curve f(x), set limits A & B, and observe volume changes with different cross-sections. Core math concepts include integration and solid geometry. Construction uses GeoGebra commands/objects like Point, Ray, Sequence, Line, Textfield, with objects f, N, g, A, h, B, list1, M, axis, list2, InputBox1, a, b, text1. Ideal for calculus teaching and volume calculation demonstrations.
GeoGebra Commands & Parameters
Point(g) → ARay(A, A + (1, 0)) → hPoint(h) → BSequence(Circle[(x(A) + (i / N * (x(B) - x(A))), f(x(A) + (i / N * (x(B) - x(A)))), 0), (x(A) + (i / N * (x(B) - x(A))), (-f(x(A) + (i / N * (x(B) - x(A))))), 0), (x(A) + (i / N * (x(B) - x(A))), 0, f(x(A) + (i / N * (x(B) - x(A)))))], i, 1, N) → list1Line((0, 0, 0), (1, 0, 0)) → axisSequence(Polygon[Sequence[Rotate[(x(A) + (i / N * (x(B) - x(A))), f(x(A) + (i / N * (x(B) - x(A)))), 0), ((j / M * 360))°, (x(A) + (i / N * (x(B) - x(A))), 0, 0), axis], j, 1, M]], i, 1, N) → list2Textfield(f) → InputBox1