
Visualizing the Normal Distribution with Integral Area
Loading the math board and drawing, please wait…
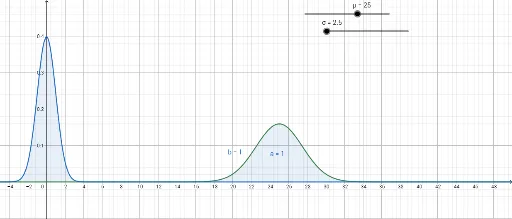
This GeoGebra example demonstrates the visualization of the normal distribution (Gaussian distribution) curve and dynamically calculates the integral area under the curve for a given interval $[a, b]$, representing the probability. The core mathematical concepts involved include the normal distribution, mean ($\mu$), standard deviation ($\sigma$), probability density function, and the application of definite integrals to find cumulative probability. In terms of construction, it utilizes the GeoGebra `Integral` command to compute the area, with key objects including $\mu$, $\sigma$, $f$, $g$, $a$, and $b$ to define the distribution shape, functions, and integration boundaries. This example is suitable for high school probability and statistics, introductory college-level calculus and statistics, or data science courses, helping learners intuitively grasp the geometric meaning of the normal distribution and interval probability.
GeoGebra Commands & Parameters
Integral(g, -100, 100) → aIntegral(f, -100, 100) → b