
Visualizing the Inverse of a Function
Loading the math board and drawing, please wait…
In collections
Geom. & Alg.: Exponential Functions & Logarithms
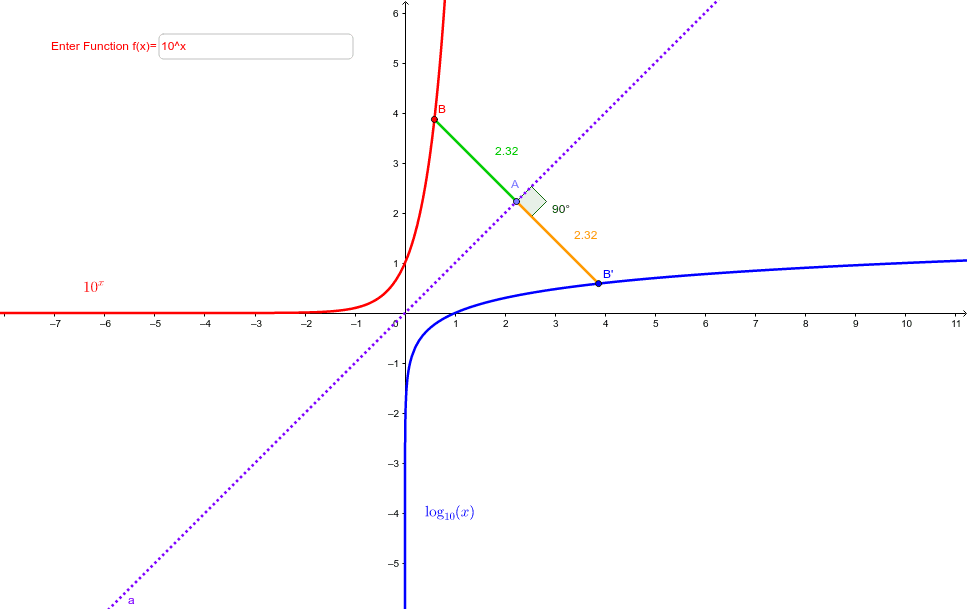
This example demonstrates how to visualize the relationship between a function and its inverse. Key math concepts include functions, inverse functions, symmetry, and analytical geometry. Construction highlights the use of Invert command to flip the function graph, Point and OrthogonalLine commands to mark key points and perpendicular lines, Intersect command to find intersections, Segment command to draw segments, Angle command to measure angles, and Textfield command to add text annotations. Suitable for high school and above mathematics learners to understand the properties and construction methods of function inverses.
GeoGebra Commands & Parameters
Invert(f) → gPoint(a) → AOrthogonalLine(A, a) → bIntersect(f, b, (0.5879418687523774, 3.8720581312445757)) → BIntersect(g, b, (3.87205813124732, 0.5879418687526852)) → B'Segment(B, A) → cSegment(A, B') → dAngle(d, a) → αTextfield(f) → inputBox1