
Visualizing the Derivative of ln(x)
Loading the math board and drawing, please wait…
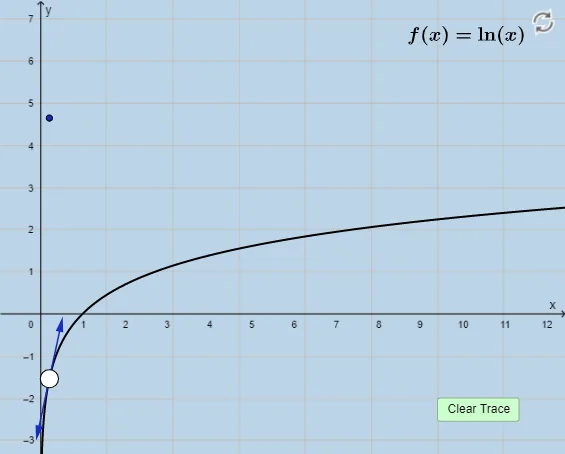
① This interactive GeoGebra example dynamically illustrates the geometric meaning of the derivative of the natural logarithm function y = ln(x), showing how the slope of the tangent line changes at any point on the curve. ② The core mathematical concept is the derivative as the slope of a tangent, involving the natural logarithm, limits, and the relationship between a function and its tangent lines. ③ Construction highlights: using GeoGebra commands such as Point, Circle, Tangent, Intersect, and Vector, along with buttons (button1, button2) and text (text1), the construction includes objects like function f, point A, circle c, tangent line g, intersection points B and C, and vectors u and v, enabling dynamic exploration. ④ Suitable for high school to early college students learning calculus, and for teachers demonstrating the geometric intuition of logarithmic derivatives in class.
GeoGebra Commands & Parameters
Point(f) → ACircle(A, 1.5) → cTangent(A, f) → gIntersect(c, g, 2) → BIntersect(c, g, 1) → CVector(A, B) → uVector(A, C) → v
AI Drawing Prompt Reference
Draw the natural logarithm function y=ln(x), then draw the tangent line at point A, and finally draw vectors u and v at the intersection points B and C of circle c and tangent line g, to show the change in the slope of the tangent line.
The prompt above was compiled from the original drawing commands and is for reference only.