
Visualizing the Derivative of cos(x)
Loading the math board and drawing, please wait…
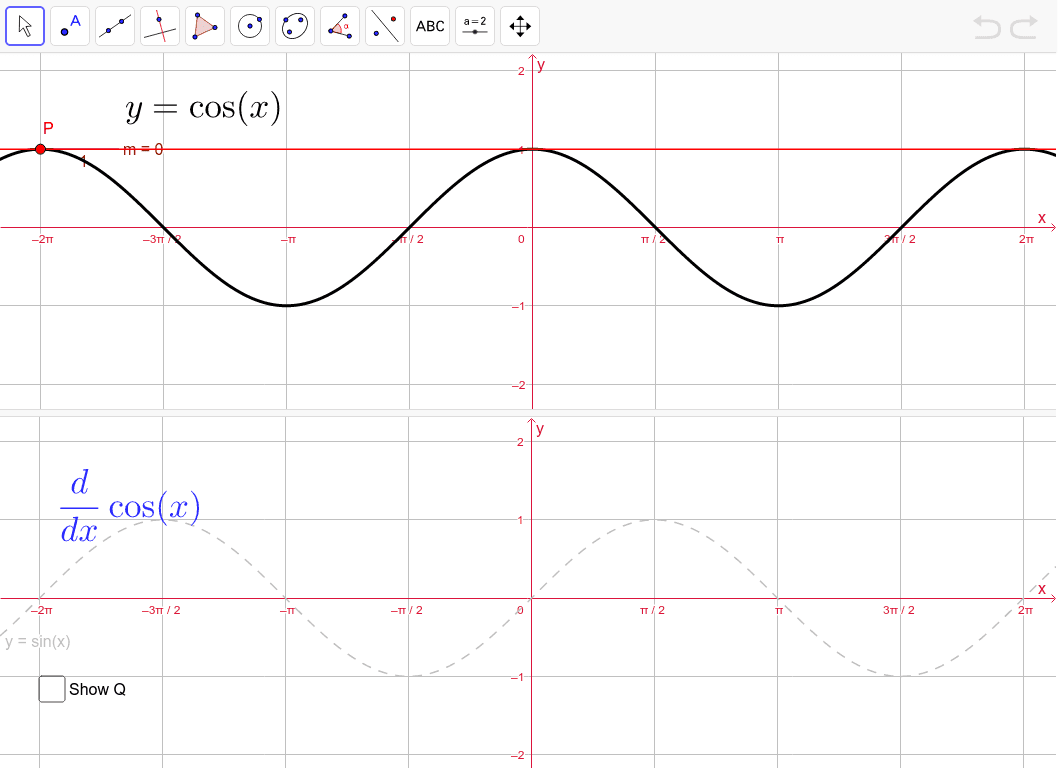
① This GeoGebra example dynamically demonstrates the derivative of the cosine function f(x)=cos(x), showing that its derivative graph is exactly -sin(x). ② The core mathematical concept is the geometric meaning of the derivative—the slope of the tangent line at each point on the curve—along with the differentiation rule for basic trigonometric functions. ③ Construction highlights: the Derivative command generates the derivative function f', the Line and Slope commands construct a tangent line at a moving point P and measure its slope, while points L, Q and text objects label key features, creating an interactive exploration environment. ④ It is suitable for high school or early college students learning calculus, serving as a classroom demonstration or self-study tool to bridge geometric intuition and symbolic differentiation.
GeoGebra Commands & Parameters
Derivative(f) → f'Line(P, A) → LSlope(L) → m
AI Drawing Prompt Reference
Create a dynamic visualization showing the derivative of the cosine function. Start by drawing the cosine curve, then automatically generate its derivative graph, which should appear as the negative sine function. Place a movable point on the cosine curve, draw a tangent line at that point, and display the slope value of this tangent. Also include a corresponding point on the derivative curve and text labels that explain the relationship between the slope and the derivative. The overall layout should clearly illustrate the geometric connection among the original function, its derivative, the tangent line, and the slope, suitable for classroom demonstration or self-study of the derivative's geometric meaning.
The prompt above was compiled from the original drawing commands and is for reference only.