
Visualizing the Definition of a Derivative: From Secant to Tangent
Loading the math board and drawing, please wait…
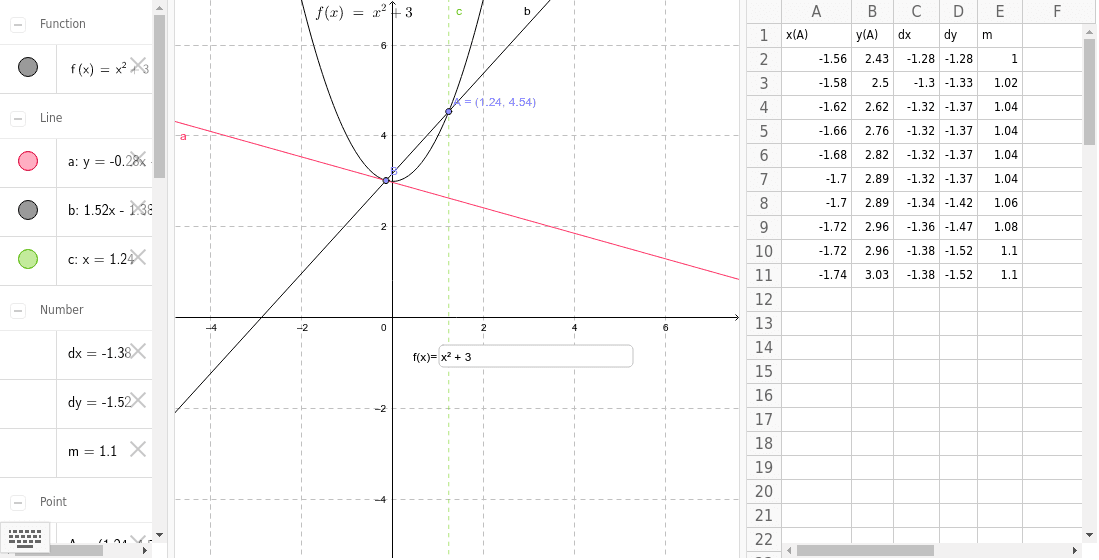
This GeoGebra example dynamically visualizes the definition of the derivative of a function at a point, showing how the slope of a secant line approaches the slope of the tangent line as the increment dx tends to zero. The core mathematical concepts include the limit definition of the derivative, secant and tangent lines, and the geometric meaning of slope and rate of change. The construction uses GeoGebra commands such as Point to place points A and B on the function f, Textfield to input the value of dx, Line and Tangent to draw the secant and tangent lines, and OrthogonalLine to create perpendicular segments that highlight the changes dx and dy. Key objects include the function f, points A and B, numerous auxiliary points (e.g., A1_1, B1_1, etc.), and a slider dx that allows users to adjust the increment and observe how the secant slope changes. This resource is suitable for high school and introductory college calculus students, serving as a visual aid for understanding the derivative concept, and can be used for classroom demonstrations or independent exploration.
GeoGebra Commands & Parameters
Point(f) → APoint(f) → BTangent(B, f) → aLine(A, B) → bName(dx) → C1_1Name(dx) → C1_2Name(dx) → C1_3Name(dy) → D1_1Name(dy) → D1_2Name(m) → E1_1Name(m) → E1_2Name(m) → E1Name(dx) → C1_4Name(dx) → C1Name(dy) → D1_3Name(dy) → D1Textfield(f) → inputBox1OrthogonalLine(A, xAxis) → c