
Visualizing the Connection Between Sine and Cosine
Loading the math board and drawing, please wait…
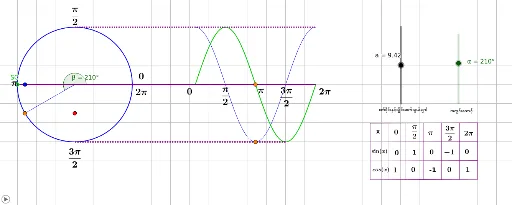
This GeoGebra example dynamically illustrates the intrinsic relationship between the sine and cosine functions, such as their phase difference, projections on the unit circle, and corresponding transformations of their graphs. Core mathematical concepts include trigonometric definitions, the unit circle, angle-to-radian conversion, and function graph transformations. Construction highlights: using GeoGebra commands like Intersect, Circle, Angle, Segment, and Point, the construction builds a moving point on the unit circle and links it to generate sine and cosine curves; objects include α, A, c, B, C, D, β, F, g, E, f, a, G, along with multiple text labels (text1 to text18) for annotations. Suitable for high school or pre-university students learning trigonometry, and useful for classroom demonstrations or self-exploration to grasp the symmetry and periodicity of sine and cosine.
GeoGebra Commands & Parameters
Intersect(xAxis, yAxis) → ACircle(A, 3) → cIntersect(c, xAxis) → C, DAngle(D, A, B) → βSegment(H, I) → hPoint(c) → JPoint(g) → KSegment(J, K) → iPoint(c) → LPoint(f) → MSegment(L, M) → jSegment(B, A) → kSegment(O, P) → lSegment(O, Q) → mSegment(Q, R) → nSegment(P, R) → pPoint(m) → SPoint(p) → TSegment(S, T) → qPoint(m) → UPoint(p) → VSegment(U, V) → rPoint(l) → WPoint(n) → ZSegment(W, Z) → sPoint(l) → A_1Point(n) → B_1Segment(A_1, B_1) → tPoint(l) → C_1Point(n) → D_1Segment(C_1, D_1) → bPoint(l) → E_1Point(n) → F_1Segment(E_1, F_1) → dPoint(l) → G_1Point(n) → H_1Segment(G_1, H_1) → e
AI Drawing Prompt Reference
Draw a unit circle centered at the origin with radius 3. Place a moving point on the circle and connect it to the center with a radius. From this point, drop perpendiculars to the x-axis and y-axis. Outside the circle, draw two perpendicular axes and plot the sine and cosine curves with angle as the horizontal axis and function value as the vertical axis. Mark the arc corresponding to the angle on the circle and display the angle value. Use dashed lines to connect the point on the circle to corresponding points on the curves, showing the relationship between angle and function value. Add text labels to explain the phase difference and periodicity of sine and cosine.
The prompt above was compiled from the original drawing commands and is for reference only.