
Unit Circle to Graphs of Sine, Cosine, Tangent and More
Loading the math board and drawing, please wait…
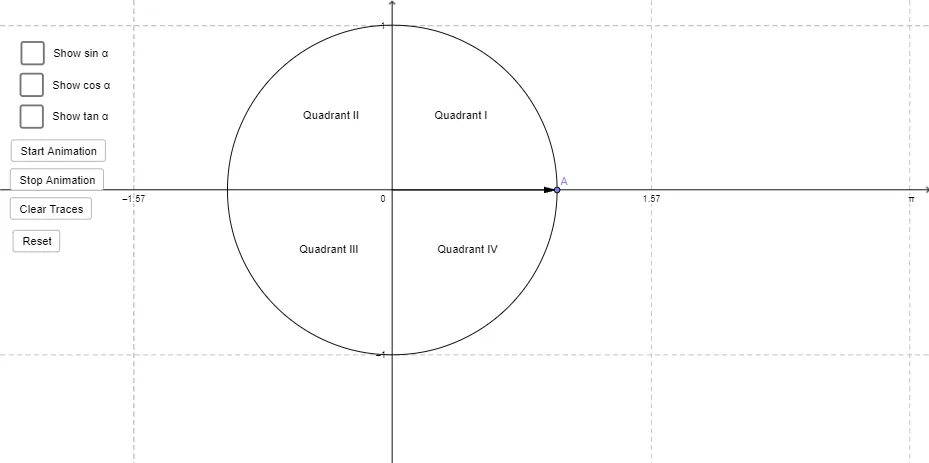
This GeoGebra demonstration links an angle on the unit circle to the graphs of the six standard trigonometric functions: sin, cos, tan, sec, csc, and cot. It shows how changing the angle α moves points on the unit circle and how their coordinates and derived ratios correspond to the function values displayed on the related graphs. The key mathematics are the unit circle definition of trigonometric functions, geometric interpretation of sine/cosine, tangent as a ratio of directed lengths, and the reciprocal functions (sec, csc) plus cotangent. Construction is based on GeoGebra commands and objects from the provided summary: Circle to build the unit circle, Point and Vector to define points and direction components (including a moving point on the circle), and Angle to represent α; computed function objects (sin, cos, tan, sec, csc, cot) update alongside interactive controls (buttons) to emphasize the relationships. Suitable for secondary school through early university trigonometry lessons and for visualizing domain/behavior near special points.
GeoGebra Commands & Parameters
Circle((0, 0), 1) → cPoint(c) → AVector(B, A) → uAngle(C, B, A) → α
AI Drawing Prompt Reference
Describe drawing a unit circle and six trigonometric function graphs (sin, cos, tan, sec, csc, cot) linked to an angle α on the circle. Point A on the circle moves with α, and its coordinates and derived ratios correspond to the function values. The construction order is to draw the circle, define point A and vector u, define angle α, and then plot the function graphs.
The prompt above was compiled from the original drawing commands and is for reference only.