
Unit Circle to Sine and Cosine Functions Dynamic Illustrator
Loading the math board and drawing, please wait…
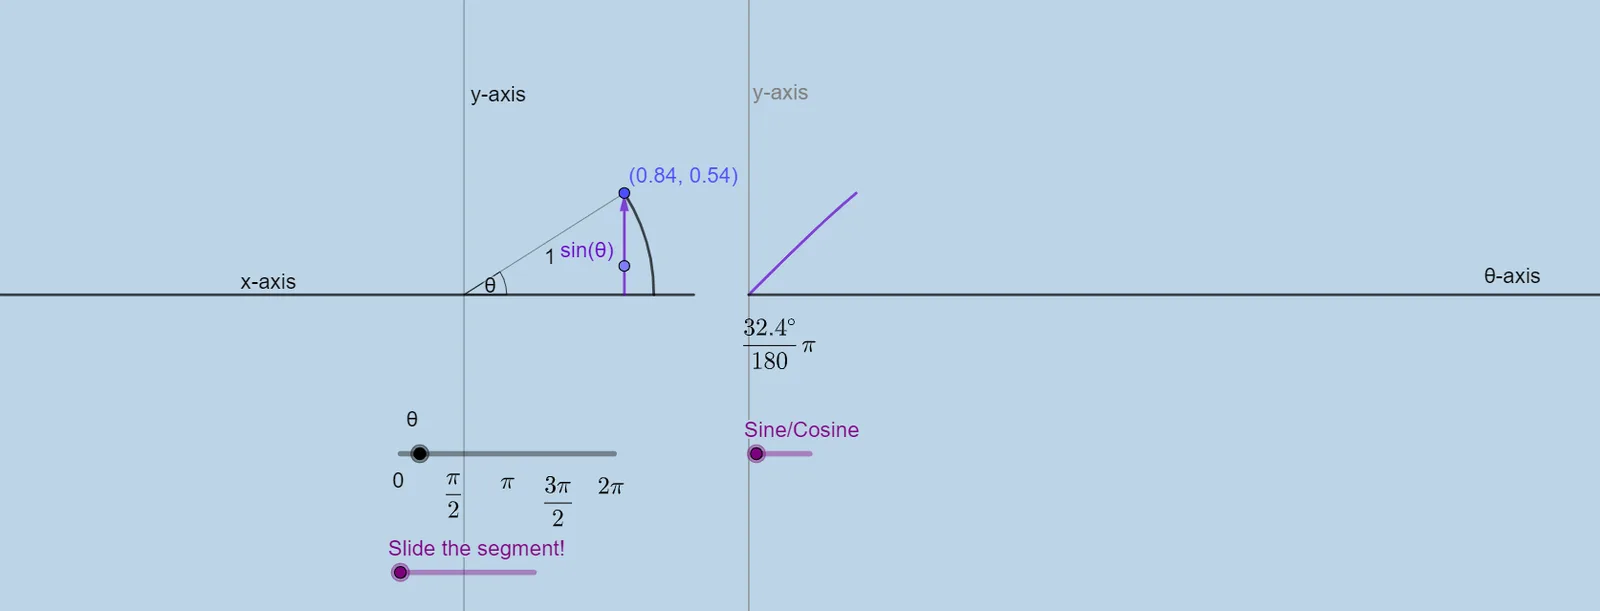
This example dynamically illustrates the relationship between points on a unit circle and the sine and cosine function graphs, visually demonstrating the definition of trigonometric functions. Core math concepts include the unit circle, trigonometric functions, coordinate geometry, angles, and vectors. Construction highlights GeoGebra commands like Rotate, OrthogonalLine, Intersect, Vector, Dilate, Translate, Angle, Segment, CircleArc, Circle, and Point. Suitable for high school students and educators seeking a deeper understanding of trigonometric function definitions.
GeoGebra Commands & Parameters
Rotate(A, ((a * 2) * pi), (0, 0)) → A'OrthogonalLine(A', xAxis) → fIntersect(f, xAxis) → BVector(B, A') → uDilate(D, If[0 < a ≤ 1, 1 - a, 0], C) → D'Vector(D', E) → vDilate(B, If[0 < b ≤ 1, 1 - b, 0], D') → B'Vector(B, B') → wTranslate(A', w) → A''Vector(B', A'') → dAngle(A, F, A') → θSegment(F, A') → kCircleArc(F, A, A') → qDilate(A, If[1 < b ≤ 2, 2 - b, 0], D) → A'_1Vector(A, A'_1) → eDilate(D, If[2 < b ≤ 3, 3 - b, 0], B') → D'_1Vector(D, D'_1) → mCircle(D'_1, 1) → rDilate(D, If[3 < b ≤ 4, 4 - b, 0], D') → D'_2Dilate(D, If[1 < b ≤ 2, 2 - b, 0], A) → D'_3Vector(D, D'_3) → nTranslate(D, n) → D'_4Vector(H, A') → sDilate(H, If[0 < b ≤ 1, 1 - b, 0], D') → H'Vector(H, H') → u_1Translate(s, u_1) → s'Translate(A', u_1) → A''_1Vector(H', A''_1) → v_1Rotate(A''_1, If[0 < b ≤ 1, (b * pi / 2), pi / 2], H') → IVector(H', I) → w_1Rotate(A''_1, If[0 < b ≤ 1, ((-b) * pi / 2), ((-pi)) / 2], H') → JIntersect(p, i, (1.5, 0)) → KOrthogonalLine(K, i) → h_1Point(i) → LPoint(i) → MPoint(i) → NSegment(K, M) → i_1Segment(N, L) → j_1Point(u) → ODilate(u, 2, O) → u'
AI Drawing Prompt Reference
Draw a unit circle centered at the origin with a point rotating on it according to an angle parameter. From this point, drop a perpendicular to the horizontal axis, mark the foot, and draw a vector from the foot to the point. To the right, plot the sine and cosine function graphs, with the rotating point and the corresponding points on the graphs moving synchronously. Use a circular arc to indicate the angle and display its measure. Additionally, include auxiliary segments and points to show relationships such as the radius, the perpendicular segment, and translated vectors as the angle changes, creating a dynamic illustration of trigonometric function definitions.
The prompt above was compiled from the original drawing commands and is for reference only.