
Visualizing the Angle Addition Postulate
Loading the math board and drawing, please wait…
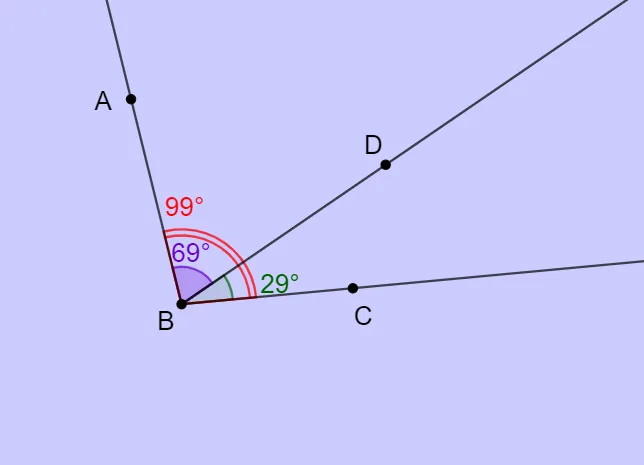
This GeoGebra example dynamically demonstrates the Angle Addition Postulate, showing how a larger angle can be decomposed into two adjacent smaller angles whose measures sum up to the measure of the larger angle. The core mathematical concepts involved include adjacent angles, rays, angle measurement (α, β, γ), and geometric addition, which form the foundation for angle arithmetic in Euclidean geometry. To construct this visualization, the GeoGebra commands `Ray` and `Angle` are utilized to define points A, B, C, D and lines f, g, h, generating the key angle variables α, β, and γ to show their additive relationship in real-time. This resource is highly suitable for middle school geometry lessons, helping teachers introduce angle subtraction and addition, and providing students with an interactive tool to explore geometric postulates.
GeoGebra Commands & Parameters
Ray(B, A) → fRay(B, D) → gRay(B, C) → hAngle(C, B, D) → αAngle(D, B, A) → βAngle(C, B, A) → γ
AI Drawing Prompt Reference
Create a dynamic visualization demonstrating the Angle Addition Postulate, showing how a larger angle can be decomposed into two adjacent smaller angles whose measures sum up to the measure of the larger angle. The diagram includes three rays forming three angles, with their measures displayed in real-time to verify their additive relationship, suitable for middle school geometry lessons.
The prompt above was compiled from the original drawing commands and is for reference only.