
Visualizing Statistical Data
Loading the math board and drawing, please wait…
In collections
Statistics and Probability with Mr Downes
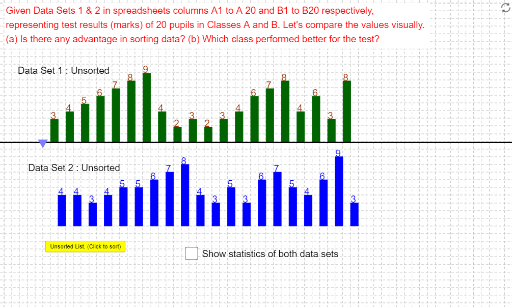
This applet demonstrates the test scores of 20 students from two classes, A and B, and analyzes the data using statistical characteristics such as mean, median, mode, and standard deviation. Commands like Sort, Intersect, Point, and Sequence are used for data sorting and processing. Suitable for high school statistics education.
GeoGebra Commands & Parameters
Sort(list1) → list1sortedIntersect(xAxis, yAxis) → APoint(xAxis) → BPoint(yAxis) → DSort(list2) → list2sortedSequence(Polygon[(n - 1, 0), (n, 0), (n, Element[list2, n / 2]), (n - 1, Element[list2, n / 2])], n, 2, 42, 2) → list2barsSequence(Polygon[(n - 2, 0), (n - 1, 0), (n - 1, Element[list2sorted, n / 2]), (n - 2, Element[list2sorted, n / 2])], n, 2, 42, 2) → list2sortedbarsPoint(l1) → O_1Sequence(Polygon[(n - 2, l1(0)), (n - 1, l1(0)), (n - 1, Element[list1sorted, n / 2] + l1(0)), (n - 2, Element[list1sorted, n / 2] + l1(0))], n, 2 + x(O_1), 41, 2) → list1sortedbarsSequence(Polygon[(n - 1, l1(n - 1)), (n, l1(n)), (n, Element[list1, n / 2] + l1(n)), (n - 1, Element[list1, n / 2] + l1(n - 1))], n, 2 + x(O_1), 42 + x(O_1), 2) → list1barsSequence(Text[Element[list1, n / 2], (n - 1, Element[list1, n / 2] + l1(0))], n, 2 + x(O_1), 42 + x(O_1), 2) → list1barstextSequence(Text[Element[list1sorted, n / 2], (n - 2, Element[list1sorted, n / 2] + l1(0))], n, 2 + x(O_1), 42 + x(O_1), 2) → list1sortedbarstextSequence(Text[Element[list2, n / 2], (n - 1, Element[list2, n / 2])], n, 2, 42, 2) → list2barstextSequence(Text[Element[list2sorted, n / 2], (n - 2, Element[list2sorted, n / 2])], n, 2, 42, 2) → list2sortedbarstext
AI Drawing Prompt Reference
Create histograms for test scores of 20 students from two classes, A and B, with two x-axes representing score ranges for each class and a y-axis showing the number of students in each range. Use the histograms to display the score distribution for each class and label the median for each score range.
The prompt above was compiled from the original drawing commands and is for reference only.