
Visualizing Sensitivity, Specificity, and Prevalence
Loading the math board and drawing, please wait…
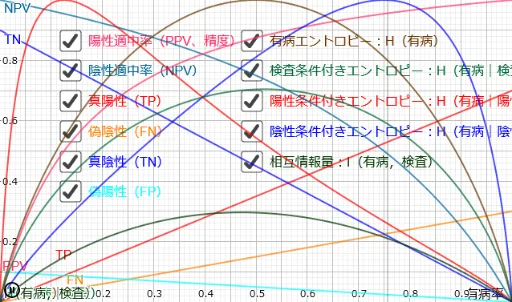
① This GeoGebra example dynamically illustrates how sensitivity (true positive rate) and specificity (true negative rate) interact with disease prevalence to determine predictive values, using rectangular areas to represent true positives, false negatives, true negatives, and false positives. ② Core mathematical concepts include conditional probability, Bayes' theorem, positive predictive value (PPV), negative predictive value (NPV), and the trade-off between sensitivity and specificity under varying prevalence. ③ Construction highlights: using GeoGebra commands such as Point, OrthogonalLine, Intersect, Segment, and Polygon, the applet builds a prevalence line, sensitivity line, specificity line, and rectangles for true positive and true negative regions, with sliders (e.g., c, d, e, f, h) enabling interactive parameter adjustment. ④ Suitable for high school and university students learning probability and statistics, as well as medical education, this tool helps intuitively grasp how prevalence affects diagnostic test performance and the balance between sensitivity and specificity.
GeoGebra Commands & Parameters
Point(Segment[C_{10}, C_{11}]) → Sp_1Point(Segment[C_{00}, C_{01}]) → Sn_0Point(Segment[C_{00}, C_{10}]) → P_0OrthogonalLine(P_0, xAxis) → PrevalenceLineIntersect(PrevalenceLine, y = 1) → P_1Segment((0, Sensitivity), (Prevalence, Sensitivity)) → SensitivityLineSegment((Prevalence, Specificity), (1, Specificity)) → SpecificityLinePolygon(C_{00}, P_0, PSn, Sn_0) → TruePositiveRect, j, k, l, mPolygon(PSp, P_0, C_{10}, Sp_1) → TrueNegativeRect, e_1, f_1, g_1, h_1Polygon(C_{01}, Sn_0, PSn, P_1) → FalseNegativeRect, i, n, p, qPolygon(C_{11}, Sp_1, PSp, P_1) → FalsePositiveRect, c_{11}, sp_1, psp, p_1
AI Drawing Prompt Reference
Draw a dynamic illustration of the relationship between sensitivity, specificity, and prevalence. First, draw the prevalence line, then determine the sensitivity and specificity lines based on the prevalence. Use rectangles to represent true positives, true negatives, false negatives, and false positives. Adjust the size of these rectangles using sliders to observe how changes in prevalence affect diagnostic test performance.
The prompt above was compiled from the original drawing commands and is for reference only.