
Visualizing Roots of Quadratic Functions
Loading the math board and drawing, please wait…
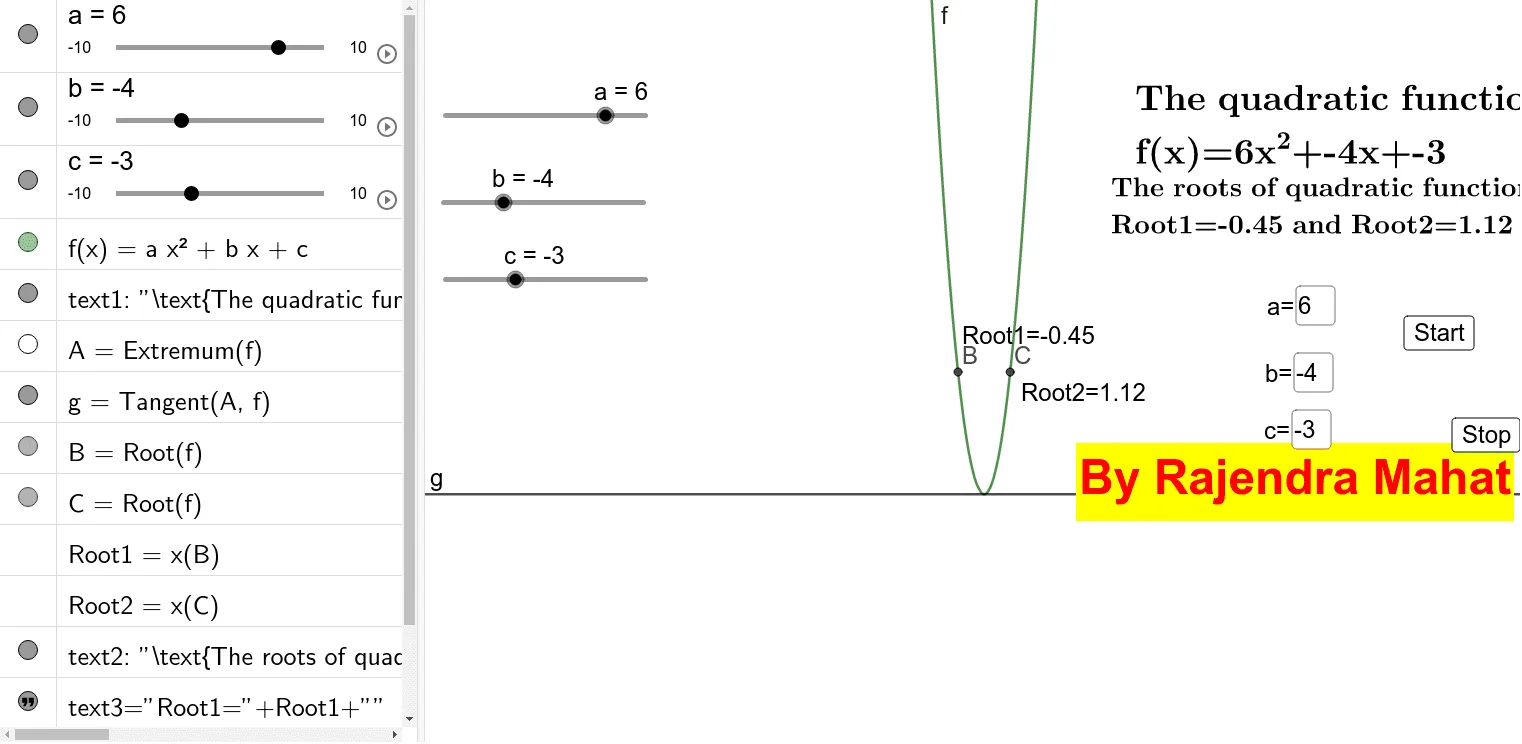
This example demonstrates how the roots of a quadratic equation are determined and interpreted from the graph of a parabola. By showing the intersection points between the function and the x-axis, learners can visually read off the solutions (roots) and relate them to key features of quadratic functions. The core concepts include quadratic functions f(x)=ax^2+bx+c, solving ax^2+bx+c=0 via geometric meaning of intersections, the parabola’s extrema and axis of symmetry, and tangent behavior near the curve. Construction in GeoGebra leverages the commands Extremum, Tangent, Root, and Textfield: parameters a, b, c define the function f, Root1 and Root2 label the two solutions, while Textfield presents the numerical/derived information. Additional objects (e.g., g and points used for the tangent/extremum visualization) connect algebraic quantities with geometric observations. Suitable for middle and high school instruction, graphing-focused lessons, and interactive classroom demonstrations.
GeoGebra Commands & Parameters
Extremum(f) → ATangent(A, f) → gRoot(f) → B, CTextfield(a) → InputBox1Textfield(b) → InputBox2Textfield(c) → InputBox3
AI Drawing Prompt Reference
Draw a parabola graph showing its vertex, tangent line, and intersection points with the x-axis. The parabola is defined by parameters a, b, c. The vertex is the minimum point, the tangent line is drawn at the vertex, and intersection points with the x-axis are marked as roots. Text boxes display the values of a, b, c to help understand the relationship between the graph and algebra.
The prompt above was compiled from the original drawing commands and is for reference only.