
Visualizing Rational and Irrational Numbers on Number Line by Radha Narve
Loading the math board and drawing, please wait…
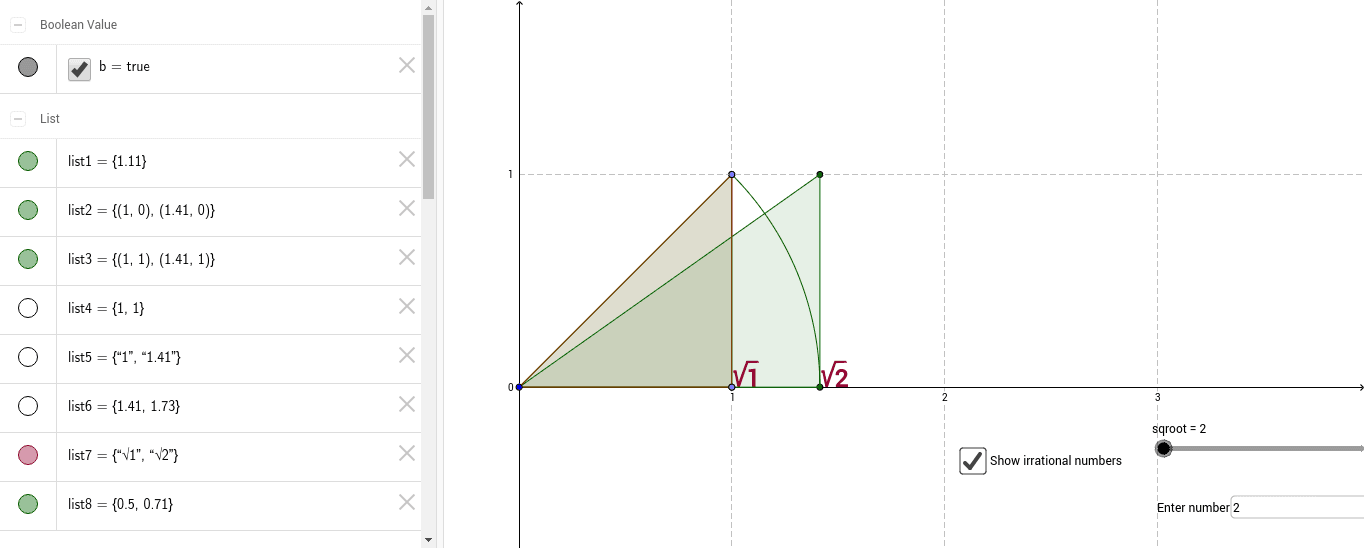
This example demonstrates the difference between rational and irrational numbers on a number line. Key mathematical concepts include point representation on the number line and the approximation of irrational numbers. Commands used include Sequence, Point, Textfield, Polygon, etc. Suitable for middle school and above students to learn about irrational numbers.
GeoGebra Commands & Parameters
Sequence((sqrt(d), 0), d, 1, sqroot, 1) → list2Sequence((sqrt(d), 1), d, 1, sqroot, 1) → list3Sequence(Segment[Element[list2, i], Element[list3, i]], i, 1, sqroot) → list4Point(yAxis) → ASequence(Segment[A, Element[list3, i]], i, 1, sqroot) → list6Sequence(CircleArc[A, Element[list2, i], Element[list3, i - 1]], i, 2, sqroot) → list1Textfield(sqroot) → inputBox1Sequence(Text[sqrt(d), (sqrt(d), 0)], d, 1, sqroot, 1) → list5Sequence(Text[(text3 * d), (sqrt(d), 0)], d, 1, sqroot, 1) → list7Point(list3) → BPoint(xAxis) → DPolygon(B, C, D) → poly1, d, b_1, c_1Sequence(Polygon[C, Element[list2, i], Element[list3, i]], i, 1, sqroot) → list8
AI Drawing Prompt Reference
Visualize rational and irrational numbers on a number line by plotting points, connecting them with line segments, and using arcs to represent irrational intervals, labeling each point with its value, and filling certain areas with polygons to distinguish between rational and irrational numbers.
The prompt above was compiled from the original drawing commands and is for reference only.