
Visualizing Quadratic Roots
Loading the math board and drawing, please wait…
In collections
AS Further Maths - Complex Numbers
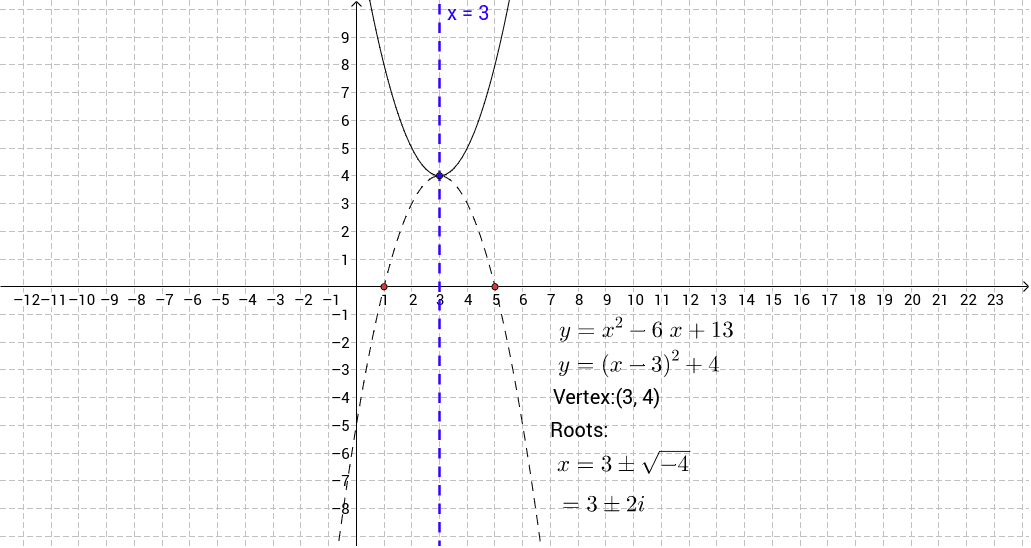
This example demonstrates the complex roots of a quadratic equation graphically by relating them to a curve of the form y=–x². It involves core math concepts like complex numbers, quadratic roots, function graphs, and coordinate geometry. Constructed using GeoGebra commands such as Intersect and OrthogonalLine. Suitable for high school mathematics education to understand the geometric meaning of complex roots and their relation to function graphs.
GeoGebra Commands & Parameters
Intersect(f, xAxis) → B, CIntersect(h, xAxis) → D, EOrthogonalLine(A, xAxis) → a
AI Drawing Prompt Reference
Draw a parabola y=-x² and show its intersections with the x-axis. Then, draw a horizontal line through these intersection points. Next, take an arbitrary point on the parabola, draw the tangent line at that point, and show its intersection with the x-axis. Finally, connect the point on the parabola to the intersection of the tangent line with the x-axis to illustrate the geometric meaning of complex roots.
The prompt above was compiled from the original drawing commands and is for reference only.