
Visualizing Quadratic Inequalities: Graphs and Solution Sets
Loading the math board and drawing, please wait…
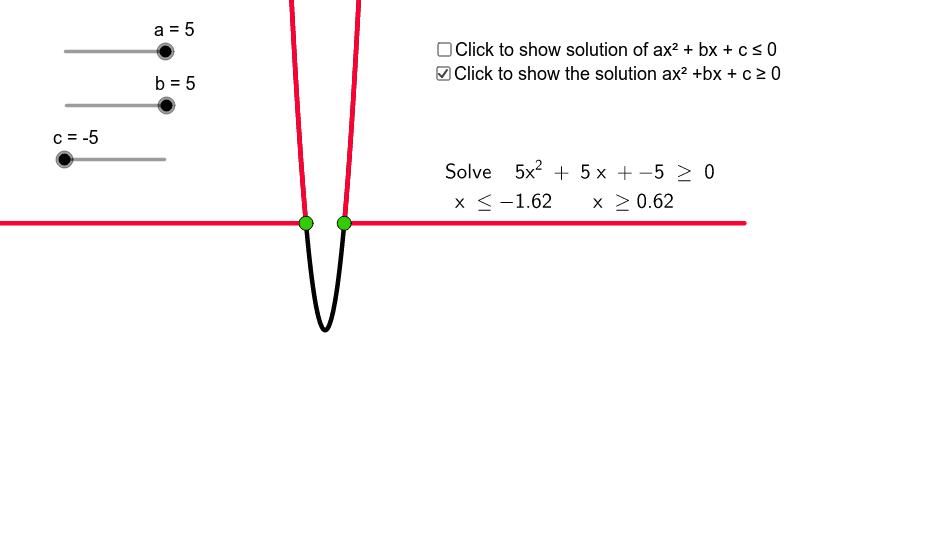
This GeoGebra example demonstrates the relationship between quadratic inequalities and their corresponding function graphs. Key mathematical concepts include quadratic functions, roots, and interval notation for solution sets. Construction utilizes the Function command to define the parabola, Root command to find zeros, Segment command to highlight solution intervals, and text objects for labeling. It is designed for high school students or educators to visualize abstract algebraic concepts through geometric interpretation, facilitating a deeper understanding of inequality solving and graphing techniques.
GeoGebra Commands & Parameters
Function(f, e, d) → gFunction(f, d, Infinity) → hRoot(f) → A, BFunction(f, -20, e) → pSegment(A, B) → iSegment(A, C) → jSegment(B, D) → k