
Visualizing Percentages
Loading the math board and drawing, please wait…
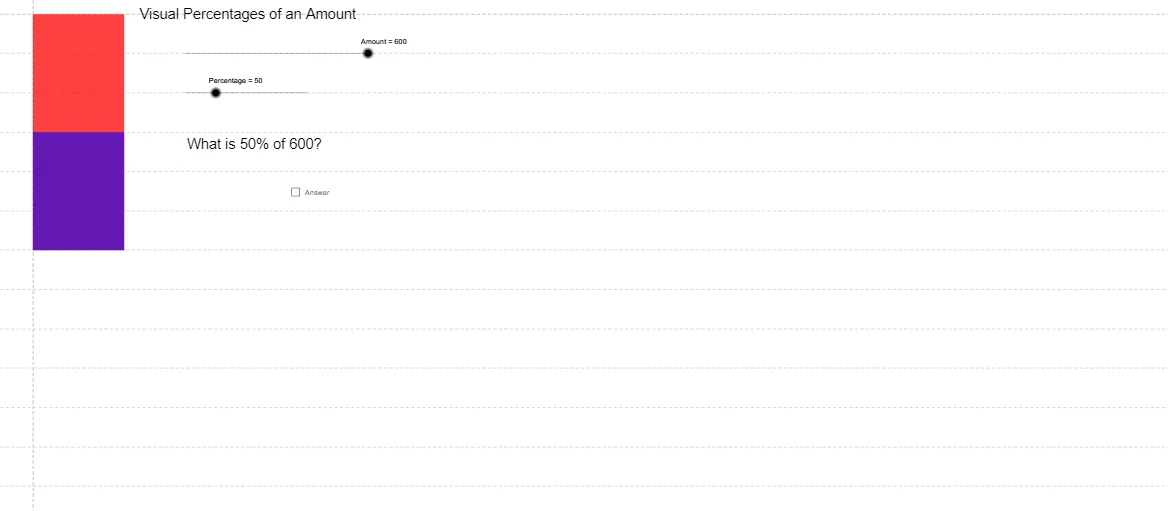
This example visually demonstrates the concept of percentages through geometric shapes. It involves proportional relationships in geometry, using polygons, slider animations, and geometric construction methods. By adjusting the slider, it dynamically shows changes in shapes based on different percentages, suitable for middle school and above students to learn about proportions and geometry.
GeoGebra Commands & Parameters
Polygon(A, B, C, D) → poly1, a, b, c, dPolygon(E, F, H, G) → poly2, e, f, h, g
AI Drawing Prompt Reference
Visualize the concept of percentages using polygons and a slider to demonstrate proportional relationships in geometry. Start by drawing two quadrilaterals, then use a slider to dynamically adjust the size of one quadrilateral to show changes at different percentage values, illustrating proportion and geometric construction.
The prompt above was compiled from the original drawing commands and is for reference only.