
Visualizing Percentages with Geometric Polygons
Loading the math board and drawing, please wait…
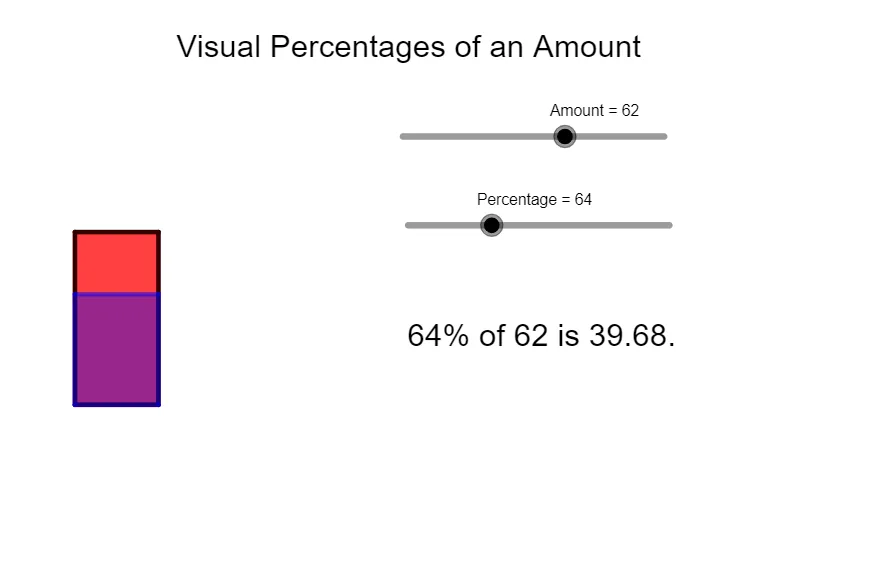
This example demonstrates how percentages can be visualized by constructing polygon regions whose measurable quantities (e.g., area or corresponding geometric proportions) represent the underlying “Amount” to “Percentage” relationships. It highlights key ideas of percentage as a ratio, geometric interpretation of quantitative comparisons, and the way function-like mapping can be used to relate numerical values to visual parts. In GeoGebra, the construction is built primarily with the Polygon command to form multiple polygonal pieces (using vertices such as A, B, C, D and E, F, G, H, producing poly1 and poly2). Supporting objects like Amount and Percentage are associated with the geometric components, while annotations (text1, text3) and the computed result (Ans) help the learner read and interpret the percentage values directly from the diagram. Suitable for middle school through early university students, and useful for teaching ratio/percentage visualization, geometry-based reasoning, and conceptually connecting geometry with functional relationships.
GeoGebra Commands & Parameters
Polygon(A, B, C, D) → poly1, a, b, c, dPolygon(E, F, H, G) → poly2, e, f, h, g
AI Drawing Prompt Reference
Draw a diagram with two polygons, a quadrilateral and a pentagon, filled in different colors, where the areas represent different percentages. Label the areas and use text annotations to explain the relationship between area and percentage, demonstrating how geometric shapes can visualize percentage concepts.
The prompt above was compiled from the original drawing commands and is for reference only.