
Visualizing Multiplication by Tim Brister
Loading the math board and drawing, please wait…
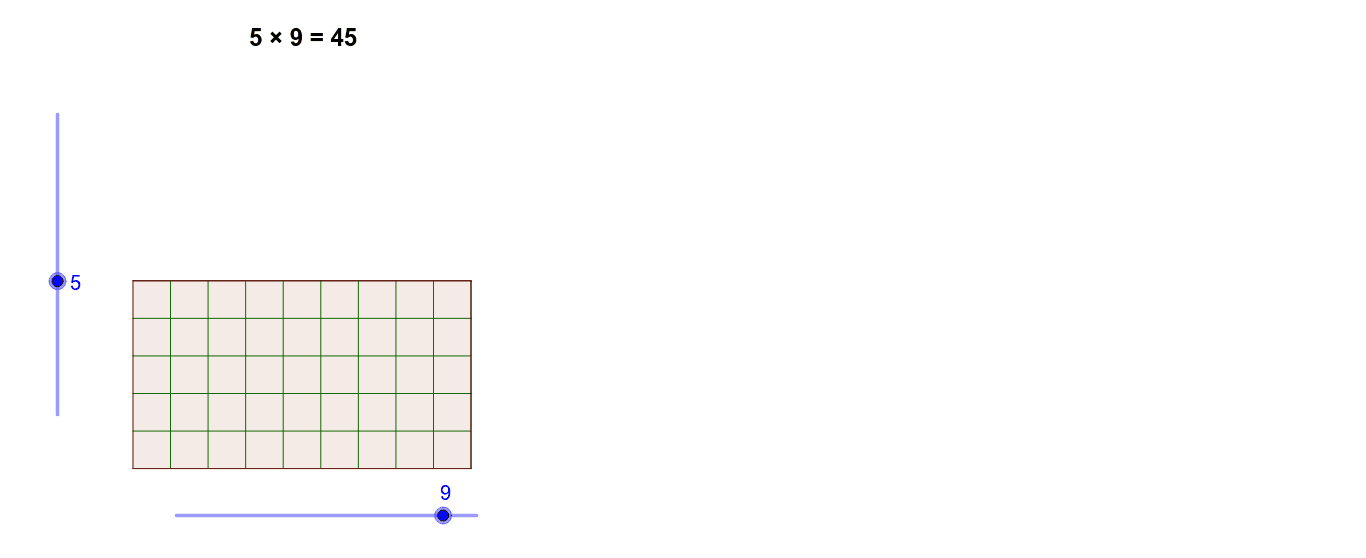
This example demonstrates the geometric meaning of multiplication through interactions between rows and columns. It involves core math concepts like function graphs, tangent functions, Pythagorean theorem, power functions, and addition. Construction highlights include using GeoGebra commands/objects such as Point, Segment, OrthogonalLine, Circle, Intersect, Line, Polygon, and Sequence to create points, segments, perpendicular lines, circles, intersections, polygons, and sequences. Suitable for high school mathematics teaching to understand the geometric representation of multiplication and function properties.
GeoGebra Commands & Parameters
Point(Circle[A, Columns]) → BSegment(A, B) → aOrthogonalLine(A, a) → bOrthogonalLine(B, a) → cCircle(A, Rows) → dIntersect(d, b) → C, DLine(D, a) → eIntersect(c, e) → EPolygon(A, B, E, D) → poly1, a_1, b_1, e_1, d_1Sequence(Segment[A + i * (1, 0), D + i * (1, 0)], i, 1, Columns) → list1Sequence(Segment[A + i * (0, 1), B + i * (0, 1)], i, 1, Rows) → list2
AI Drawing Prompt Reference
Create a geometric visualization to demonstrate the concept of multiplication, involving points, line segments, perpendicular lines, a circle, and intersection points. Start by drawing a circle and then mark two points on a line segment. Next, draw two perpendicular lines intersecting the segment. Find two points where these perpendiculars intersect the circle, and connect them to form a quadrilateral. Finally, draw two sets of parallel line segments extending from the endpoints of the segment, creating a grid-like structure.
The prompt above was compiled from the original drawing commands and is for reference only.