
Visualizing Multiplication and Statistical Characteristics
Loading the math board and drawing, please wait…
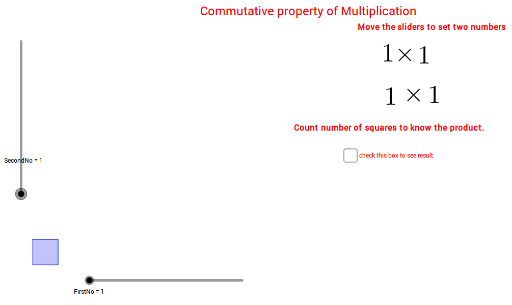
① This GeoGebra example demonstrates the relationship between multiplication operations and statistical characteristics such as mode, frequency distribution, and addition, using dynamic geometric constructions. ② Core mathematical concepts include multiplication, percentages, mode, frequency distribution, addition, and statistical measures, all visualized through interactive diagrams. ③ Construction details: The example employs GeoGebra commands such as Point, Segment, OrthogonalLine, Circle, Intersect, Line, Polygon, Sequence, and Text, along with objects like FirstNo, SecondNo, points A, B, C, D, segments, polygons, and text labels, to build a model that links arithmetic and statistics. ④ This resource is ideal for upper elementary and middle school students, as well as teachers, to explore multiplication facts and statistical concepts in an engaging, visual way.
GeoGebra Commands & Parameters
Point(Circle[A, FirstNo]) → BSegment(A, B) → aOrthogonalLine(A, a) → bOrthogonalLine(B, a) → cCircle(A, SecondNo) → dIntersect(d, b, 2) → CLine(C, a) → eIntersect(c, e) → DPolygon(A, B, D, C) → poly1, a_1, b_1, d_1, c_1Sequence(Segment[A + (i * (1, 0)), C + (i * (1, 0))], i, 1, FirstNo) → list1Sequence(Segment[A + (i * (0, 1)), B + (i * (0, 1))], i, 1, SecondNo) → list2Text(SecondNo) → text1