
Probability and Geometry Interaction Demo
Loading the math board and drawing, please wait…
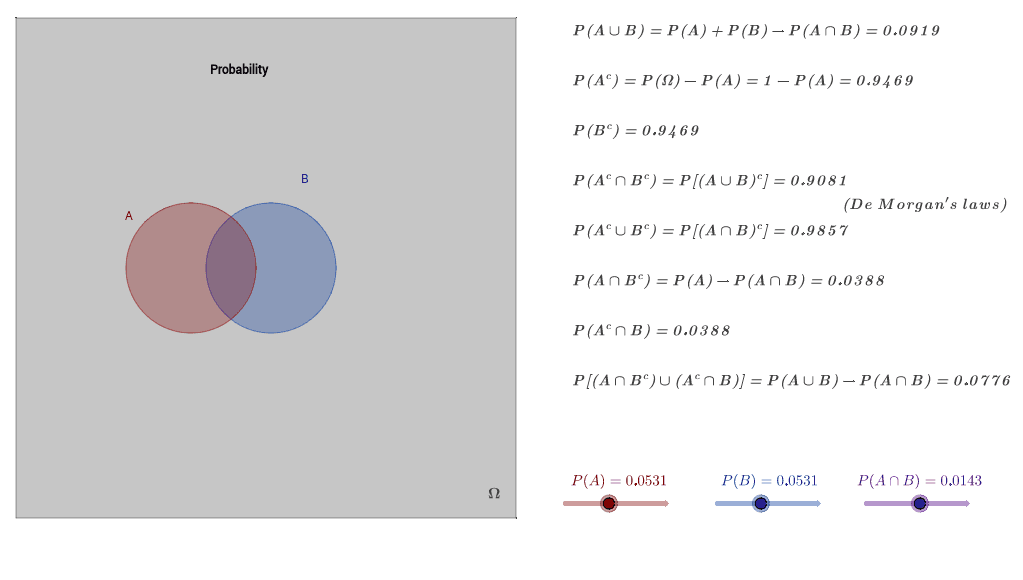
This example demonstrates the interplay between probability calculations and geometric shapes (circles, polygons, matrices, etc.) through interactive graphics; core math concepts include probability, fractions, coordinate geometry, solid geometry, and calculus; construction highlights from the summary involve GeoGebra commands/objects like Point, Circle, Intersect, Polygon, CircleSector, If, Segment; suitable for high school and above learners to understand the cross-application of probability & statistics and geometry.
GeoGebra Commands & Parameters
Point(Circle[A, abs(d)]) → BCircle(B, b) → fCircle(A, a) → cIntersect(c, f) → C, D, ,Polygon(D, B, C, A) → poly2, d_1, b_1, c_1, a_1CircleSector(B, C, D) → hCircleSector(A, D, C) → gIf((abs(a - b) < d) ∧ (d < a + b), P_C, If[d < a - b, P_B, If[d < b - a, P_A, 0]]) → P'_CSegment(A, B) → ePolygon(E, G, H, F) → poly1, e_2, g_1, h_1, f_1
AI Drawing Prompt Reference
Draw a circle c with center A and radius a, and another circle f with center B and radius b, which intersect at points C and D. Connect points A and B to form segment e. Form sector h with vertices B, C, and D, and sector g with vertices A, D, and C. Calculate the probability P'_C based on given conditions. Finally, form polygon poly1 with vertices E, G, H, and F.
The prompt above was compiled from the original drawing commands and is for reference only.