
Visualizing Möbius Transformations on the Riemann Sphere
Loading the math board and drawing, please wait…
In collections
GeoGebra, Complex Maps and Riemann Sphere
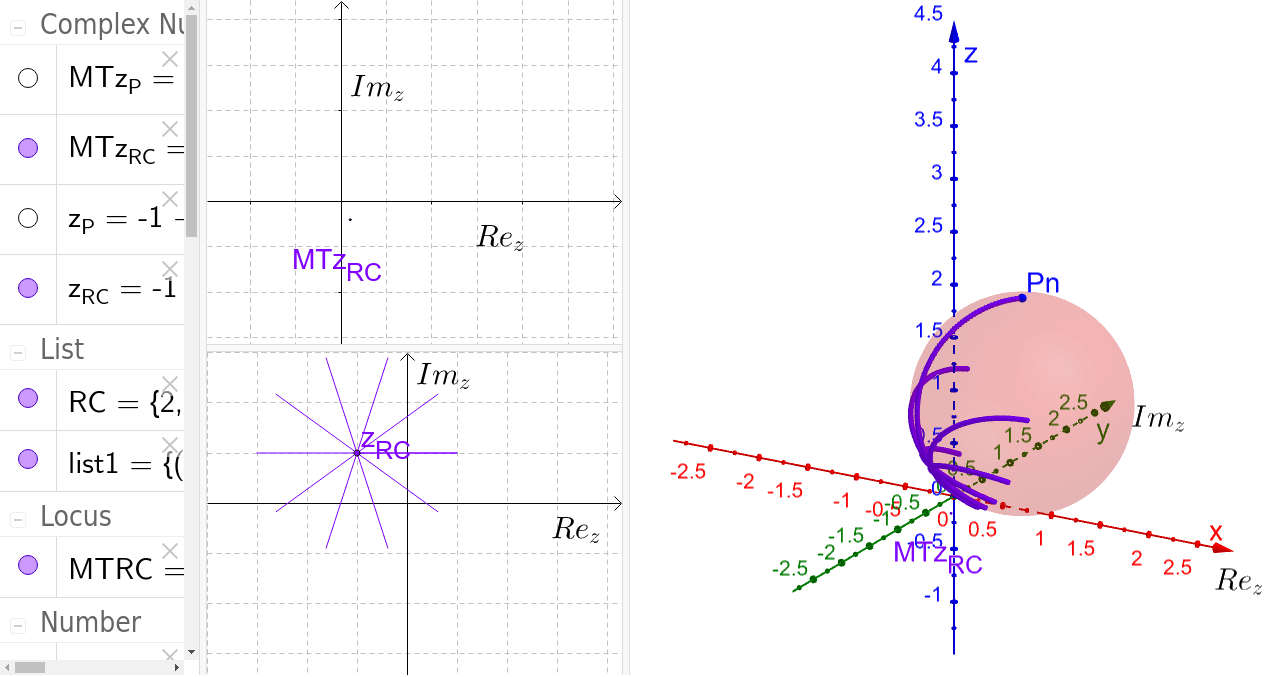
This example uses the 3D capabilities of GeoGebra to visualize the effects of Möbius transformations on a set of objects in the Riemann Sphere. It demonstrates how Möbius transformations distort and transform points on the sphere. Key math concepts include the Riemann Sphere, Möbius transformations, and 3D visualization. The construction utilizes GeoGebra commands like Sequence, Point, Locus, Sphere, and Intersect. Suitable for high school and above, this example helps understand complex functions and geometric transformations.
GeoGebra Commands & Parameters
Sequence(Rotate[Segment[(real(z_{RC}), imaginary(z_{RC})), (real(z_{RC}) + l, imaginary(z_{RC}))], ((j * 2) * π / n), (real(z_{RC}), imaginary(z_{RC}))], j, 0, n, 1) → RCPoint(RC) → z_PLocus(MTz_P, z_P) → MTRCSphere((x(Pn), y(Pn), z(Pn) - r), r) → eIntersect(Segment[Pn, MTz_P], Sphere[(x(Pn), y(Pn), z(Pn) - r), r], 2) → RSMTz_PSequence(Intersect[Segment[Pn, ((a * Point[RC, t]) + b) / ((c * Point[RC, t]) + d)], Sphere[(x(Pn), y(Pn), z(Pn) - r), r], 2], t, 0, 1, 1 / p) → list1Locus
AI Drawing Prompt Reference
Visualize Möbius transformations on a Riemann Sphere by 3D rendering the effects on a set of objects. Start by generating a sequence of rotated line segments in the complex plane, map them to the sphere, and draw their transformed loci. Then, create spheres centered at points on the sphere and compute intersections with transformed segments. Finally, generate a series of transformed points and trajectories to illustrate how Möbius transformations distort and transform the sphere.
The prompt above was compiled from the original drawing commands and is for reference only.