
Visualizing First and Second Derivatives
Loading the math board and drawing, please wait…
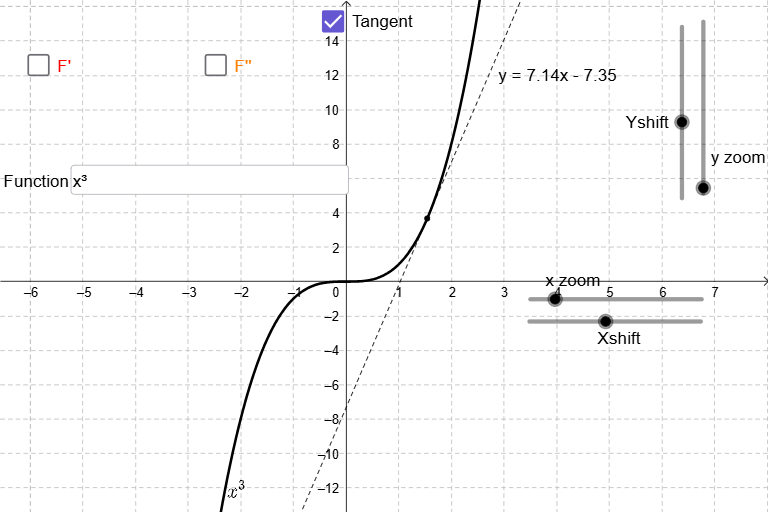
This interactive GeoGebra example visualizes the first and second derivatives of a function, allowing users to toggle graphs on or off to explore relationships between the original function, its tangent lines, and derivative curves. Core mathematical concepts include the definition of the derivative, slope of tangent lines, and how the second derivative indicates concavity. Construction uses the Derivative command to generate F' and F'', Point and Tangent commands to place points and draw tangents on the curves, Textfield and sliders (Xshift, Yshift, Xzoom, yZoom) for panning and zooming, and an input box (inputBoxF) to dynamically change the function. Suitable for high school and college calculus courses to deepen understanding of derivative geometry and function behavior.
GeoGebra Commands & Parameters
Derivative(F) → F'Derivative(F') → F''Point(F) → PointOnFTangent(PointOnF, F) → TangentFPoint(F') → PointOnF'Tangent(PointOnF', F') → TangentF'Textfield(F) → inputBoxF
AI Drawing Prompt Reference
Draw a function F and its first and second derivatives. First, plot the function F, then draw the tangent line TangentF on F. Next, calculate the first derivative F' and draw the tangent line TangentF' on F'. Finally, add an input box inputBoxF to dynamically change the function F.
The prompt above was compiled from the original drawing commands and is for reference only.