
Visualizing Face Value and Place Value of a Number
Loading the math board and drawing, please wait…
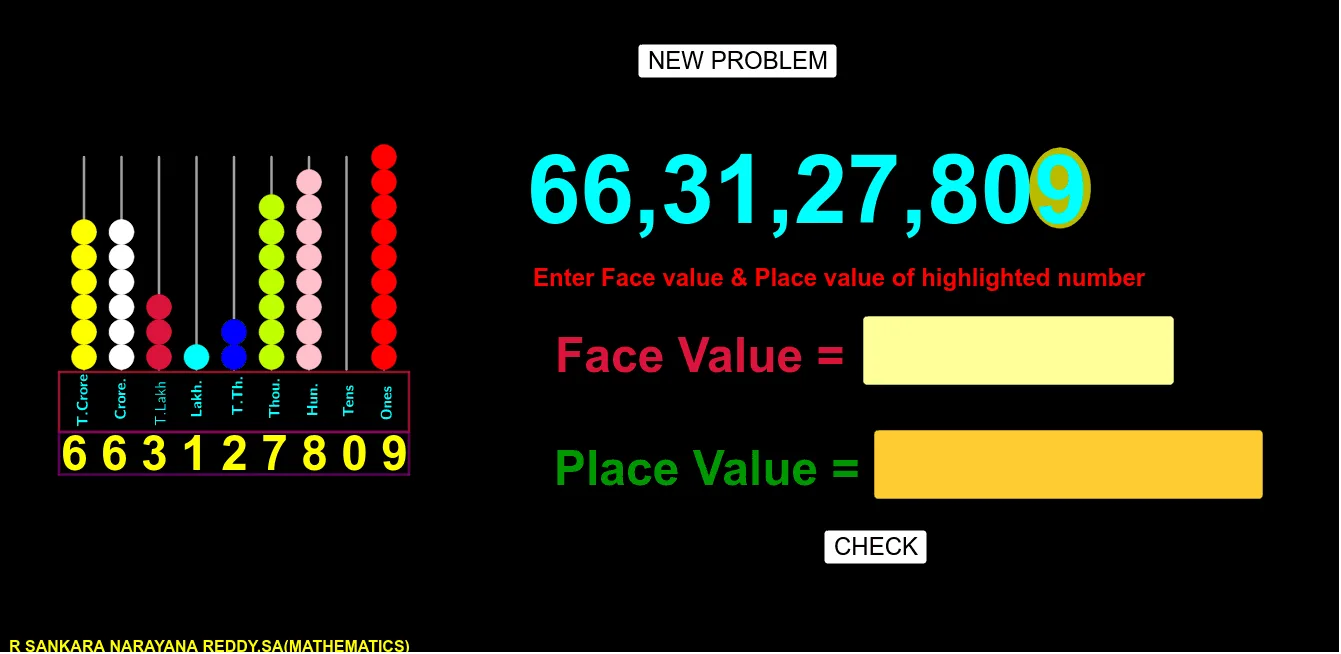
This GeoGebra example demonstrates how a multi-digit number can be decomposed into its face-value and place-value contributions, showing how each digit’s position determines its weighted amount. The key math ideas are the base-10 place-value system, digit-wise expansion of numbers, and representing these contributions using geometric components whose sizes/placements encode the corresponding weights. In the construction, it uses commands such as Vector, Ellipse, Translate, Polygon, and Textfield to build geometric structures and labels; Random and RandomElement to generate example parameters and digits; If to branch logic for which parts to display; and Sequence to manage an ordered presentation of place-value terms. Objects like the indexed points/text entries (e.g., I, H, G, F, E, n, w, v, u, D, C, and labeled segments L_1–L_6) support the mapping from the numeric decomposition to the visual diagram. Suitable for middle-school learners, classroom interaction, and conceptual teaching of place value through dynamic visualization.
GeoGebra Commands & Parameters
Vector(E, I) → nVector(E, H) → wVector(E, G) → vVector(E, F) → uEllipse(C, D, E) → pTranslate(p, n) → p'_3Translate(p'_3, u) → sTranslate(p, w) → p'_2Translate(p'_2, u) → rTranslate(p, v) → p'_1Translate(p'_1, u) → qTranslate(p, u) → p'Translate(p', u) → ppRandomElement(L_{16}) → tRandom(1, 9) → aRandom(0, 9) → iRandom(0, 9) → hRandom(0, 9) → gRandom(0, 9) → fRandom(0, 9) → eRandom(0, 9) → dRandom(0, 9) → cRandom(0, 9) → bIf(t ≟ s, (a * 100000000), If[t ≟ p'_3, (b * 10000000), If[t ≟ r, (c * 1000000), If[t ≟ p'_2, (d * 100000), If[t ≟ q, (e * 10000), If[t ≟ p'_1, (f * 1000), If[t ≟ pp, (g * 100), If[t ≟ p', (h * 10), i]]]]]]]) → d_1Sequence(A + (0, i / 2), i, 1, 9) → L_2Sequence(L_2 + (i, 0), i, 1, 9) → L_3Sequence(Segment[A + ((3 * i / 4), 0), B + ((3 * i / 4), 0)], i, 0, 8) → L_1Sequence(Circle[(0.75, 0) + (0, i / 2), 0.25], i, 1, b) → L_5Sequence(Circle[(1.5, 0) + (0, i / 2), 0.25], i, 1, c) → L_6Sequence(Circle[(2.25, 0) + (0, i / 2), 0.25], i, 1, d) → L_7Sequence(Circle[(3, 0) + (0, i / 2), 0.25], i, 1, e) → L_8Sequence(Circle[(3.75, 0) + (0, i / 2), 0.25], i, 1, f) → L_9Sequence(Circle[(6.75, 0) + (0, j / 2), 0.25], j, 1, i) → L_{13}Sequence(Circle[(0, 0) + (0, i / 2), 0.25], i, 1, a) → L_4RandomElement(L_{14}) → jIf(j ≟ a, (100000000 * a), If[j ≟ b, (10000000 * b), If[j ≟ c, (1000000 * c), d]]) → kIf(j ≟ a, (100000000 * a), If[j ≟ b, (10000000 * b), If[j ≟ c, (1000000 * c), If[j ≟ d, (100000 * d), If[j ≟ e, (10000 * e), If[j ≟ f, (1000 * f), If[j ≟ g, (100 * g), If[j ≟ h, (10 * h), i]]]]]]]) → lRandomElement(L_{15}) → text3If(text3 ≟ text2, i, f) → mIf(t ≟ p, i, If[t ≟ p', h, If[t ≟ pp, g, If[t ≟ p'_1, f, If[t ≟ q, e, If[t ≟ p'_2, d, If[t ≟ r, c, If[t ≟ s, a, b]]]]]]]) → a_1If(t ≟ p, i, If[t ≟ p', h, If[t ≟ pp, g, If[t ≟ p'_1, f, If[t ≟ q, e, If[t ≟ p'_2, d, If[t ≟ r, c, If[t ≟ s, a, b]]]]]]]) → oIf(o ≟ a, (100000000 * a), If[o ≟ b, (10000000 * b), If[o ≟ c, (1000000 * c), If[o ≟ d, (100000 * d), If[o ≟ e, (10000 * e), If[o ≟ f, (1000 * f), If[o ≟ g, (100 * g), If[o ≟ h, (10 * h), i]]]]]]]) → b_1If(text2 ≟ text6, text9, text8) → text10If(text5 ≟ text7, text9, text8) → text11Textfield(text2) → InputBox1Textfield(text5) → InputBox2Polygon((-0.5, 0.2), (6.5, 0.2), (6.5, -1), (-0.5, -1)) → q1, f_1, g_1, h_1, i_1VerticalText(text14) → text15VerticalText(text16) → text24VerticalText(text17) → text25VerticalText(text18) → text26VerticalText(text19) → text27VerticalText(text20) → text28VerticalText(text21) → text29Sequence(Circle[(6, 0) + (0, j / 2), 0.25], j, 1, i) → L_{12}Polygon((-0.5, -1.85), (6.5, -1.85), (6.5, -1), (-0.5, -1)) → q1_1, j_1, k_1, l_1, m_1Sequence(Circle[(4.5, 0) + (0, i / 2), 0.25], i, 1, g) → L_{10}Sequence(Circle[(5.25, 0) + (0, i / 2), 0.25], i, 1, h) → L_{11}VerticalText(text22) → text30VerticalText(text23) → text31If(text2 ≟ text6 ∧ text5 ≟ text7, pic1, pic2) → pic3
AI Drawing Prompt Reference
Create a dynamic visual diagram for explaining base‑10 place value decomposition. Place several arrows from the same reference point to define distinct shift directions that represent different place‑value steps. Use one ellipse as the main component, then repeatedly translate it along these shift vectors in an ordered sequence to form multiple parts whose relative positions encode the corresponding weighted contributions of each digit. Include interactive text input boxes to choose digits and show how the selected digits map to the displayed contributions. Arrange a row of small circular units in aligned positions to indicate the available digit-weight options, and add a large polygonal label area plus vertically oriented text for explanatory context.
The prompt above was compiled from the original drawing commands and is for reference only.