
Visualizing a System of Linear Equations by Pathamaporn Awachai
Loading the math board and drawing, please wait…
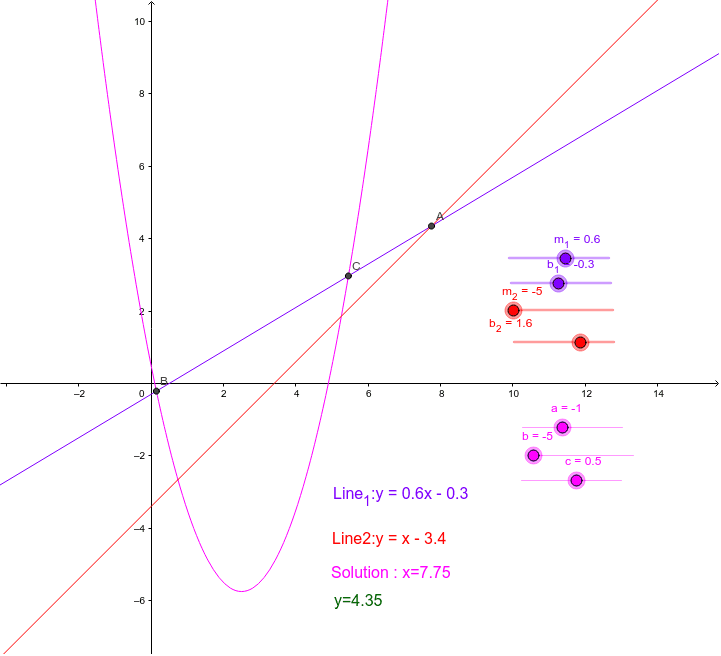
This example dynamically demonstrates the intersection of two lines to visually show the solution set of a system of linear equations. Key math concepts include linear equations, coordinate geometry, intersection points, slopes, and y-intercepts. GeoGebra commands and objects used in construction are Intersect, line, parameters (m_1, b_1, m_2, b_2), and text elements. Suitable for high school mathematics education to understand the geometric meaning of solutions to linear systems and the effect of parameter changes on the graph.
GeoGebra Commands & Parameters
Intersect(line_1, line_2) → AIntersect(f, line_1) → B, C
AI Drawing Prompt Reference
Draw a Cartesian coordinate plane with two straight lines representing a system of linear equations. Each line should have a distinct slope and y-intercept, and their equations should be labeled. The two lines intersect at a single point, which is the solution to the system; mark this intersection point clearly with its coordinates. Additionally, include a curve (such as a parabola or another function graph) that intersects one of the lines at two separate points, and mark these intersection points as well. The overall figure should clearly show the relationships between the lines and the curve, and how changing parameters affects the lines' positions, suitable for high school geometry instruction.
The prompt above was compiled from the original drawing commands and is for reference only.