
Visualize the Derivative
Loading the math board and drawing, please wait…
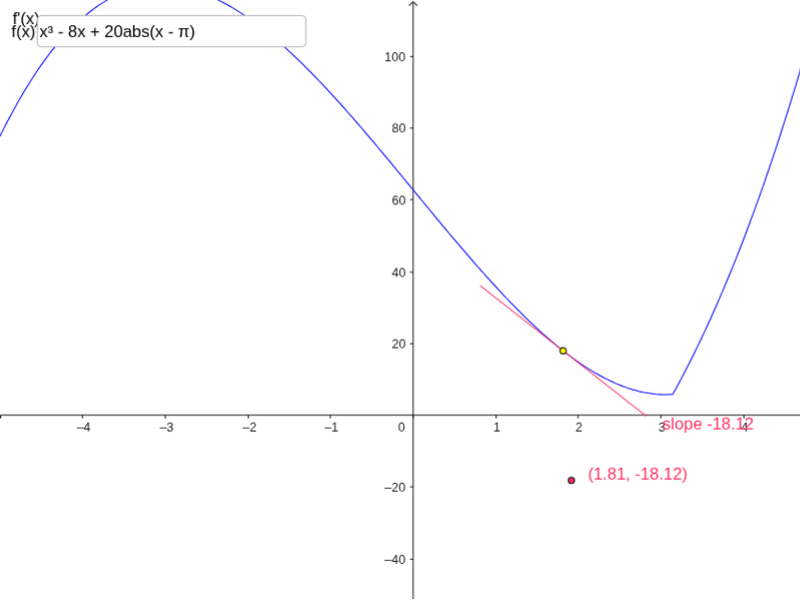
This example dynamically illustrates the concept of derivatives. It involves the slope of a function and tangents. Using GeoGebra commands such as Textfield, Derivative, Point, etc., it provides a visual understanding of the geometric meaning of derivatives. Suitable for high school mathematics education and learning.
GeoGebra Commands & Parameters
Textfield(f) → inputBox1Derivative(f) → gPoint(f) → fPointPoint((tangentLineWidth / 2 * {1, g(c)})) → fSlopeSegment(fPoint - fSlope, fPoint + fSlope) → tangentLineText("slope " + (g(c)), fPoint + (1.2 * fSlope)) → text1Point({c + 0.1, g(c)}) → derivPointRemoveUndefined(Sequence[f(t), t, -5, 5, 0.5]) → fRangeRemoveUndefined(Sequence[g(t), t, -5, 5, 0.5]) → gRangeText("(" + c + ", " + (g(c)) + ")", derivPoint + (0.2, 0)) → gText
AI Drawing Prompt Reference
Draw a function and its derivative, showing the tangent line and slope at a specific point. First, draw the function graph, then calculate and display the derivative of the function. Next, select a point on the function graph and draw the tangent line at that point, labeling the slope of the tangent line. Finally, label the coordinates and function value near the tangent line.
The prompt above was compiled from the original drawing commands and is for reference only.