
Visual Representation of Standard Deviation in a Dotplot
Loading the math board and drawing, please wait…
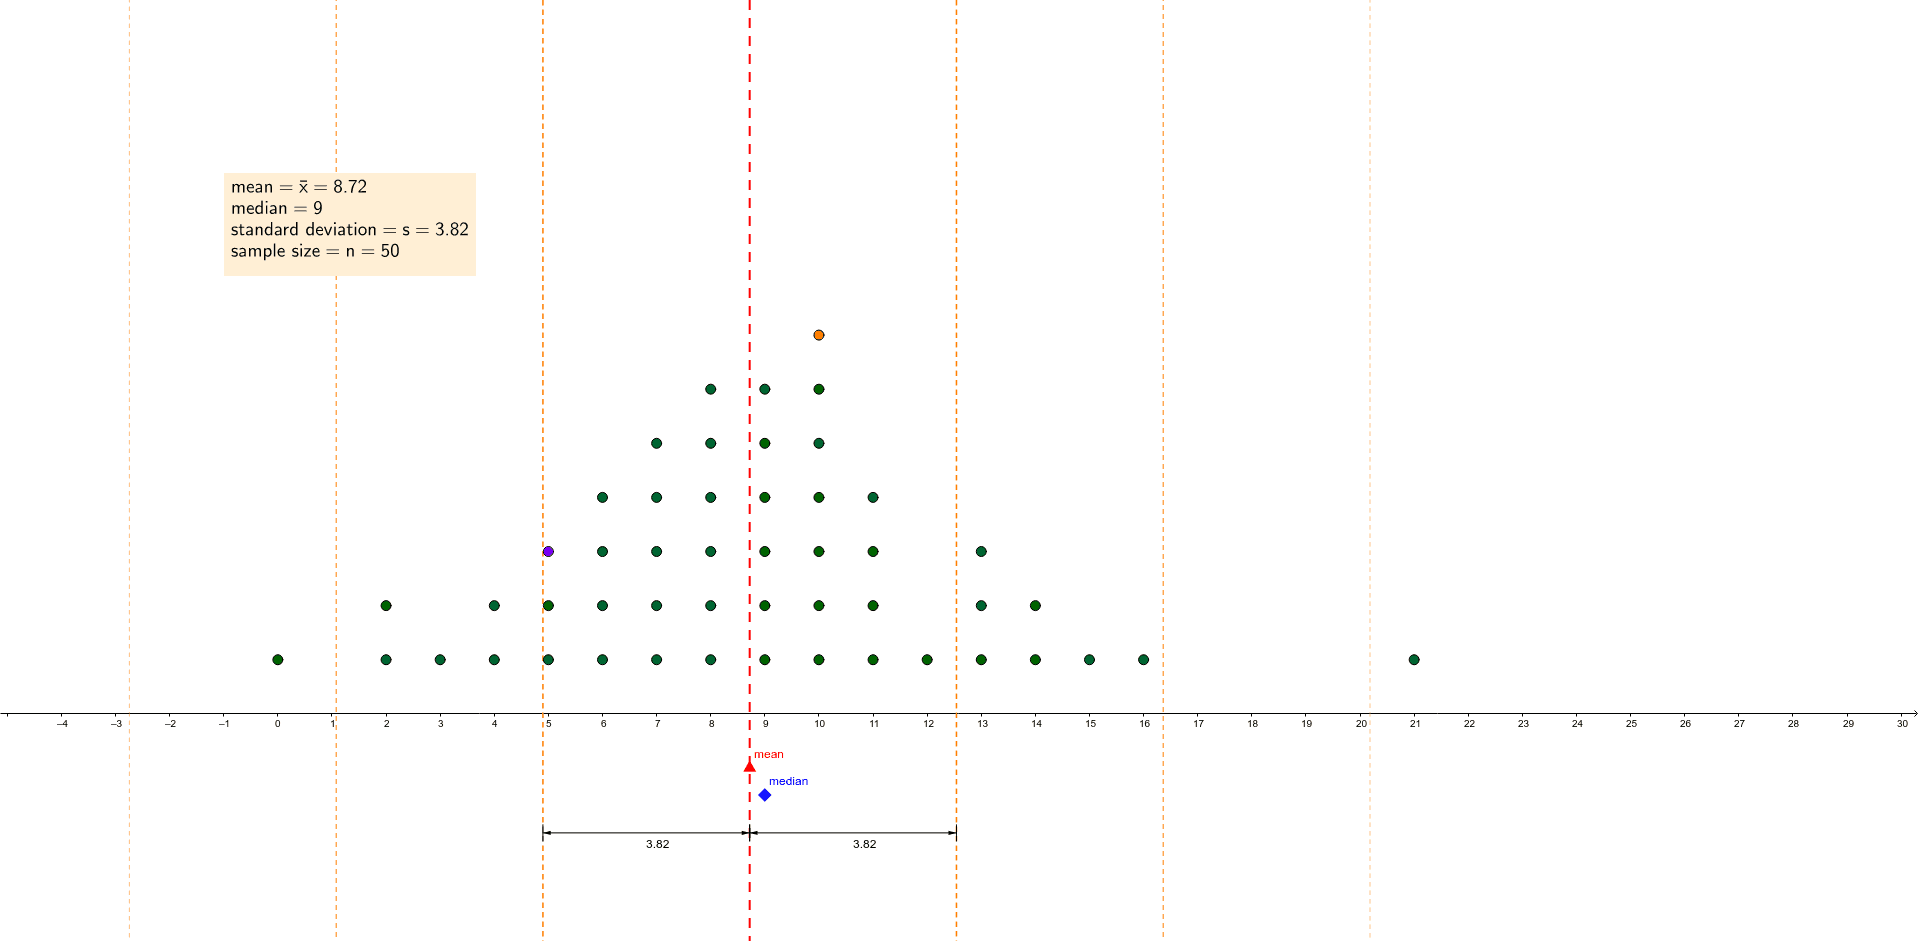
This example visually demonstrates the concept of standard deviation through a dotplot. It involves core mathematical concepts such as mean, median, standard deviation, and data distribution. The construction utilizes GeoGebra commands and objects like Mean, Median, SD, Point, DistanceMarkerWithFixedScale, and Length. It is suitable for high school mathematics education, aiding students in understanding the application of standard deviation in data analysis and statistics.
GeoGebra Commands & Parameters
Mean(list2) → B1Median(list2) → B2SD(list2) → B3Point(a) → MEANDistanceMarkerWithFixedScale(STDEV_1, STDEV_3, 0.3) → d, e, f, poly1, poly2DistanceMarkerWithFixedScale(STDEV_2, STDEV_1, 0.3) → g, h, i, poly3, poly4Length(list2) → B4