
Vertical Translation: Shifting Function Graphs Up and Down
Loading the math board and drawing, please wait…
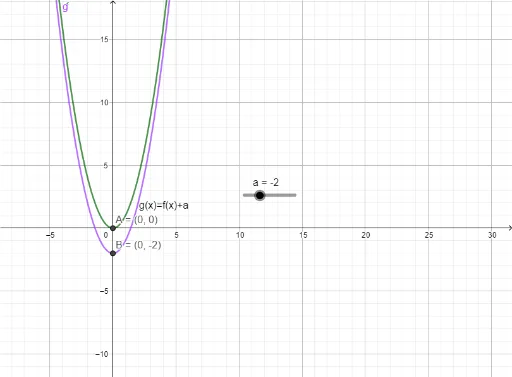
① This example demonstrates the vertical translation of a function graph, showing how adding or subtracting a constant to the function expression shifts the entire curve upward or downward, with intersection points moving accordingly. ② Core mathematical concepts include function graph transformations, vertical shifts, intersection points between curves and lines, and the relationship between algebraic changes and geometric movement. ③ Construction highlights: using GeoGebra's Intersect command to compute intersection points A and B between the function f and auxiliary lines a or g, and displaying coordinates or shift values via text1; a slider or parameter controls the vertical shift amount, enabling dynamic observation of graph and point movement. ④ Suitable for middle and high school mathematics (grades 8–12) when teaching function transformations, as well as introductory calculus or precalculus courses, fostering visual understanding of how constants affect function graphs and supporting inquiry-based learning.
GeoGebra Commands & Parameters
Intersect(f, yAxis) → AIntersect(g, yAxis) → B
AI Drawing Prompt Reference
Draw a coordinate plane with a function curve and its vertically shifted version. The original curve and the shifted curve each intersect the y-axis at distinct points. Include a slider to control the vertical shift amount; as the slider moves, the entire shifted curve moves up or down, and the intersection points change accordingly. Display the shift value or the y-coordinates of the intersection points as text on the graph. The graph should clearly show the relative positions of the two curves and how their y-axis intersections vary with the shift.
The prompt above was compiled from the original drawing commands and is for reference only.