
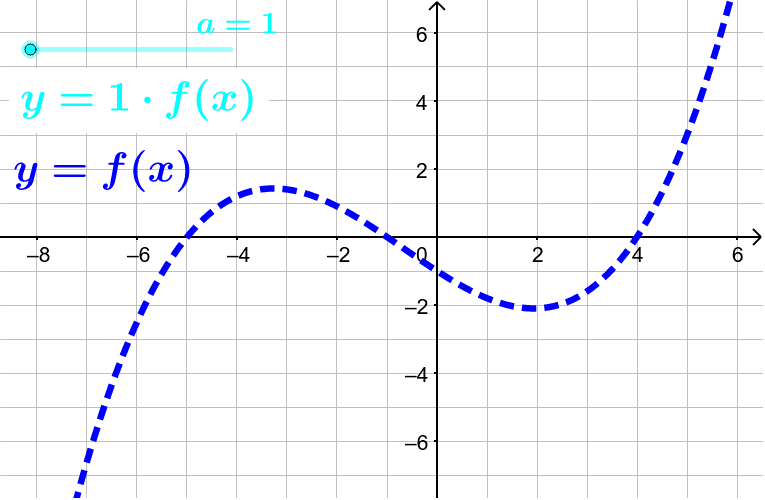
Vertical Dilations with a>1
Loading the math board and drawing, please wait…
This example demonstrates the transformation of function graphs under vertical dilation when a>1. Key math concepts include function transformations, vertical dilation, and the effect of coefficient 'a' on the graph. It uses GeoGebra's Sequence command to generate function sequences, a slider to control the dilation factor 'a', and objects like functions f and g, and text annotations. Suitable for high school mathematics teaching to understand function transformations and the impact of parameters on graph shapes.
GeoGebra Commands & Parameters
Sequence(Segment[(i, g(i)), (i, 0)], i, -6, 6, 1.5) → list1
AI Drawing Prompt Reference
Draw a function graph and show its vertical dilation transformation where the stretch factor is greater than 1. Use dashed lines to connect points on the function graph to the x-axis, forming a grid to visually represent the difference before and after the transformation.
The prompt above was compiled from the original drawing commands and is for reference only.