
Venn Diagram with Numbers: Visualizing Set Operations and Counting
Loading the math board and drawing, please wait…
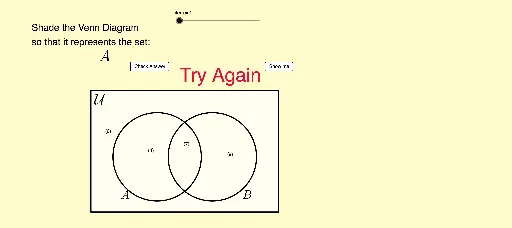
① This example demonstrates how to construct a Venn diagram with numeric labels in GeoGebra, visually illustrating set intersections, unions, and complements, with counts displayed in each region. ② Core mathematical concepts include set theory (intersection, union, complement), frequency distribution, and counting statistics; it also involves the geometric construction of a general quadrilateral to frame the set regions. ③ Construction highlights: from the summary, commands such as Segment, If, Element, Length, Polygon, and Corner are used; objects include multiple points (A, B, C, D, E, F, U), variables (a, b, c, d, e, f, g, h, k, p), and color-control objects (IsGreen1-4, RB1-4, G1-4), likely for conditional coloring of different set areas. ④ Suitable for middle and high school mathematics (set theory and probability/statistics), as well as introductory college courses, serving as an interactive tool for understanding set operations and counting principles.
GeoGebra Commands & Parameters
Segment((x_1, y_1), (x_1, y_2)) → eSegment((x_1, y_2), (x_2, y_2)) → fSegment((x_2, y_1), (x_2, y_2)) → gSegment((x_2, y_1), (x_1, y_1)) → hIf(IsGreen1, 0, 1) → RB1If(IsGreen1, 0.4, 1) → G1If(IsGreen2, 0, 1) → RB2If(IsGreen3, 0, 1) → RB3If(IsGreen4, 0, 1) → RB4If(IsGreen2, 0.4, 1) → G2If(IsGreen3, 0.4, 1) → G3If(IsGreen4, 0.4, 1) → G4Element(problem, item, 1) → textitemLength(problem) → iElement(problem, item, 2) → keyPolygon(Corner[1], Corner[2], Corner[3], Corner[4]) → poly1, l, m, n, qCorner(5) → G
AI Drawing Prompt Reference
Create a Venn diagram with a large rectangular frame and two overlapping circles, dividing the interior into four distinct regions: only in the first circle, only in the second circle, the intersection, and the outside of both circles. Place a numeric label in each region representing the count of elements. Use distinct colors for the four regions, with adjustable numbers and colors via sliders. The diagram is set within a quadrilateral frame whose corners align with the canvas edges, and the circles' positions and sizes are adjustable, with numbers clearly centered in each region.
The prompt above was compiled from the original drawing commands and is for reference only.