
Venn Diagram: Set Intersection and Union Visualization
Loading the math board and drawing, please wait…
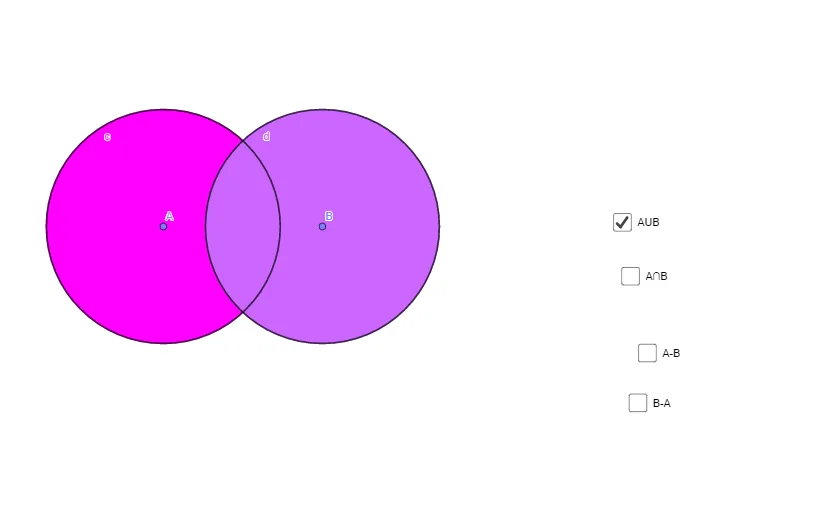
This GeoGebra example demonstrates a classic Venn diagram built from two intersecting circles, visually representing the relationships between two sets, including intersection, union, and exclusive regions. The core mathematical concepts involve set theory, set operations such as intersection and union, logical inclusion and exclusion, and applications in probability and statistics. The construction relies on GeoGebra commands Point, Circle, Intersect, and CircleArc, using objects A, c, B, d and text labels text1 through text4 to annotate distinct regions of the diagram. It is suitable for middle school and high school mathematics instruction, especially in lessons on sets, logic, and introductory probability, as well as for general data visualization and logical reasoning demonstrations.
GeoGebra Commands & Parameters
Point(xAxis) → ACircle(A, 2) → cPoint(xAxis) → BCircle(B, 2) → dCircle(A, 2) → eCircle(B, 2) → fIntersect(e, f) → C, D, ,CircleArc(A, D, C) → gCircleArc(B, C, D) → hCircleArc(A, C, D) → kCircleArc(B, C, D) → pCircleArc(B, D, C) → qCircleArc(A, D, C) → r
AI Drawing Prompt Reference
Draw two equal circles whose centers lie on the same horizontal line so that they intersect at two points. Use circular arcs to outline the left-only region, the right-only region, and the overlapping intersection region, and place text labels inside each region reading “left only”, “right only”, and “intersection”. The result is a classic two‑set Venn diagram showing union, intersection, and set differences.
The prompt above was compiled from the original drawing commands and is for reference only.