
Venn Diagram for Set Theory
Loading the math board and drawing, please wait…
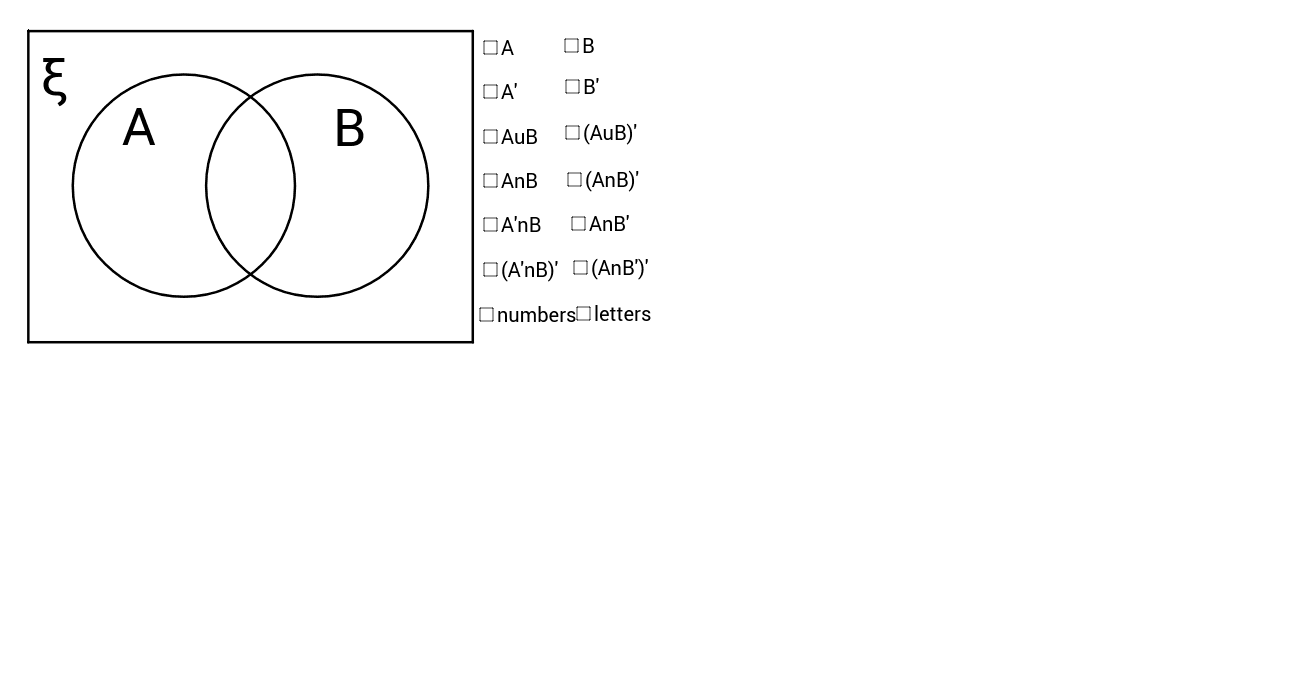
This example demonstrates Venn diagrams in set theory, visually representing the values of sets through movable letters and numbers. It involves core math concepts like sets, intersections, unions, complements, and set operations. Constructed using GeoGebra commands: Point, Circle, Polygon, Intersect, CircleArc. Suitable for high school mathematics teaching, aiding in the visualization of set relationships and operations, and also applicable to advanced topics like linear programming or optimization.
GeoGebra Commands & Parameters
Point(yAxis) → ACircle(A, 5) → AboldPoint(xAxis) → BCircle(B, 5) → BboldPolygon(C, D, E, F) → Ubold, c_1, d_1, e, fIntersect(Abold, Bbold, 1) → GIntersect(Abold, Bbold, 2) → HCircleArc(A, G, H) → AarcCircleArc(B, G, H) → AsarcCircleArc(A, H, G) → BsarcCircleArc(B, H, G) → BarcCircle(A, 5) → AshadeCircle(B, 5) → BshadePolygon(C, D, E, F) → Ushade, K_2, K_3, K_4, K_5Circle(A, 5) → AwhiteCircle(B, 5) → BwhiteCircleArc(B, G, H) → AsarcwhiteCircleArc(A, H, G) → BsarcwhiteCircleArc(A, H, G) → BsarcxCircleArc(B, G, H) → Asarcx
AI Drawing Prompt Reference
Draw a Venn diagram for set theory showing two intersecting circles with different colors and patterns to distinguish intersection, union, and complement regions, including movable letters and numbers, and connect the intersection points with arcs to illustrate set operations, suitable for high school mathematics teaching.
The prompt above was compiled from the original drawing commands and is for reference only.