
Velocity, Position, and Acceleration vs. Time Graphs
Loading the math board and drawing, please wait…
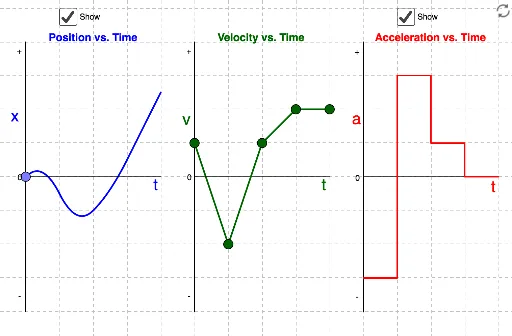
This example demonstrates the relationship between Velocity vs. Time, Position vs. Time, and Acceleration vs. Time graphs by allowing users to manipulate the velocity graph. Key math concepts include function graphing, kinematics, and calculus derivatives/integrals. Constructed using GeoGebra commands like Segment, Point, and Midpoint. Ideal for high school physics and mathematics education.
GeoGebra Commands & Parameters
Segment(A, B) → a_3Point(a_3) → RSegment((5, -4), (5, 4)) → m1Point(m1) → ESegment((6, -4), (6, 4)) → m2Point(m2) → FSegment(E, F) → aSegment((9, -4), (9, 4)) → m5Segment((8, -4), (8, 4)) → m4Segment((7, -4), (7, 4)) → m3Midpoint(a_3) → DSegment(D, C) → bSegment(A_1, B_1) → a_1Midpoint(a_1) → D_1Segment(D_1, C_1) → b_1Segment(A_2, B_2) → a_2Midpoint(a_2) → D_2Segment(D_2, C_2) → b_2Point(m3) → GSegment(F, G) → cPoint(m4) → HSegment(G, H) → dPoint(m5) → ISegment(H, I) → eSegment(J, K) → fSegment(K, L) → gSegment(L, M) → hSegment(M, N) → iSegment(N, O) → jSegment(O, P) → kSegment(P, Q) → l
AI Drawing Prompt Reference
Draw three vertically arranged coordinate systems to represent velocity, position, and acceleration versus time. On the velocity graph, draw a line segment and vertical segments at both ends to form a rectangle. Connect the midpoints of these segments and extend more lines from the rectangle's vertices to create complex geometric patterns. Similarly, draw the position and acceleration graphs with different shapes to illustrate function relationships and calculus concepts.
The prompt above was compiled from the original drawing commands and is for reference only.