
Velocity and Position Integral Exploration
Loading the math board and drawing, please wait…
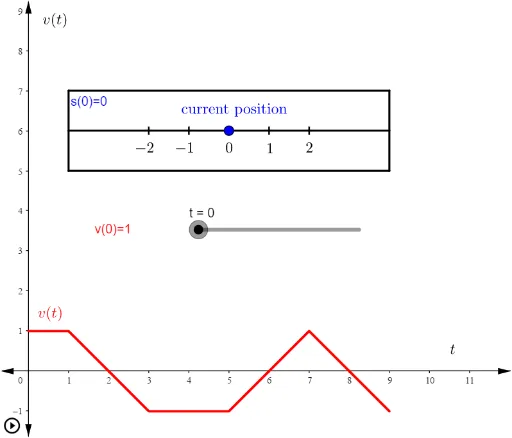
This example demonstrates the integral relationship between velocity-time and position-time graphs, visually illustrating the role of integration in physical motion. Core mathematical concepts include definite integrals, the Fundamental Theorem of Calculus, and function graph transformations. GeoGebra commands like Integral and Polygon are used for graphical construction and dynamic visualization. Suitable for high school students and calculus beginners learning integral applications and physics modeling.
GeoGebra Commands & Parameters
Integral(v, 0, t) → sPolygon(F, H, I, G) → q1, f_1, h, i, g
AI Drawing Prompt Reference
Draw a velocity-time graph and a position-time graph, showing the velocity curve and position curve over time, use the integral tool to display the definite integral of velocity with respect to time under the velocity-time graph, which corresponds to the position change on the position-time graph, visually demonstrating the role of integration in physical motion, and use the polygon tool to connect key points on the velocity-time graph, forming the area under the velocity curve to further verify the relationship between integration and area.
The prompt above was compiled from the original drawing commands and is for reference only.