
Vectors and Hyperbola: Coordinate Statistics under Geometric Transformations
Loading the math board and drawing, please wait…
In collections
Vectors and scalars
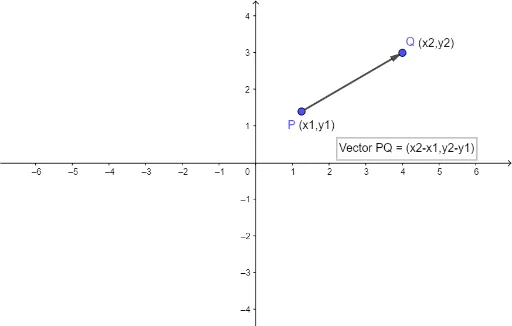
This GeoGebra example demonstrates the construction of a hyperbola-related figure using vector tools, integrating geometric transformations with coordinate statistics. The core mathematical concepts include the definition and properties of hyperbolas, vector representation and translation, coordinate systems, and geometric transformations such as translation and rotation. The construction uses the Vector command to create vector u, defines points P and Q, and generates text objects text1, text2, and text3 to display coordinates or statistical characteristics. This example is suitable for high school or early college students to understand the role of vectors in geometric construction, how to combine algebraic coordinates with geometric figures, and to foster dynamic exploration and mathematical modeling skills.
GeoGebra Commands & Parameters
Vector(P, Q) → u
AI Drawing Prompt Reference
Draw a hyperbola with its asymptotes and curve. Place two points on the hyperbola, and draw a vector arrow from the first point to the second. Add three text labels near the figure: one for each point's coordinates, and one for the vector's components or magnitude. The composition should emphasize the connection between vectors and coordinate geometry, showing how the vector represents a translation between the two points on the hyperbola.
The prompt above was compiled from the original drawing commands and is for reference only.