
Vector-Valued Function Derivative and Tangent Vector Visualization
Loading the math board and drawing, please wait…
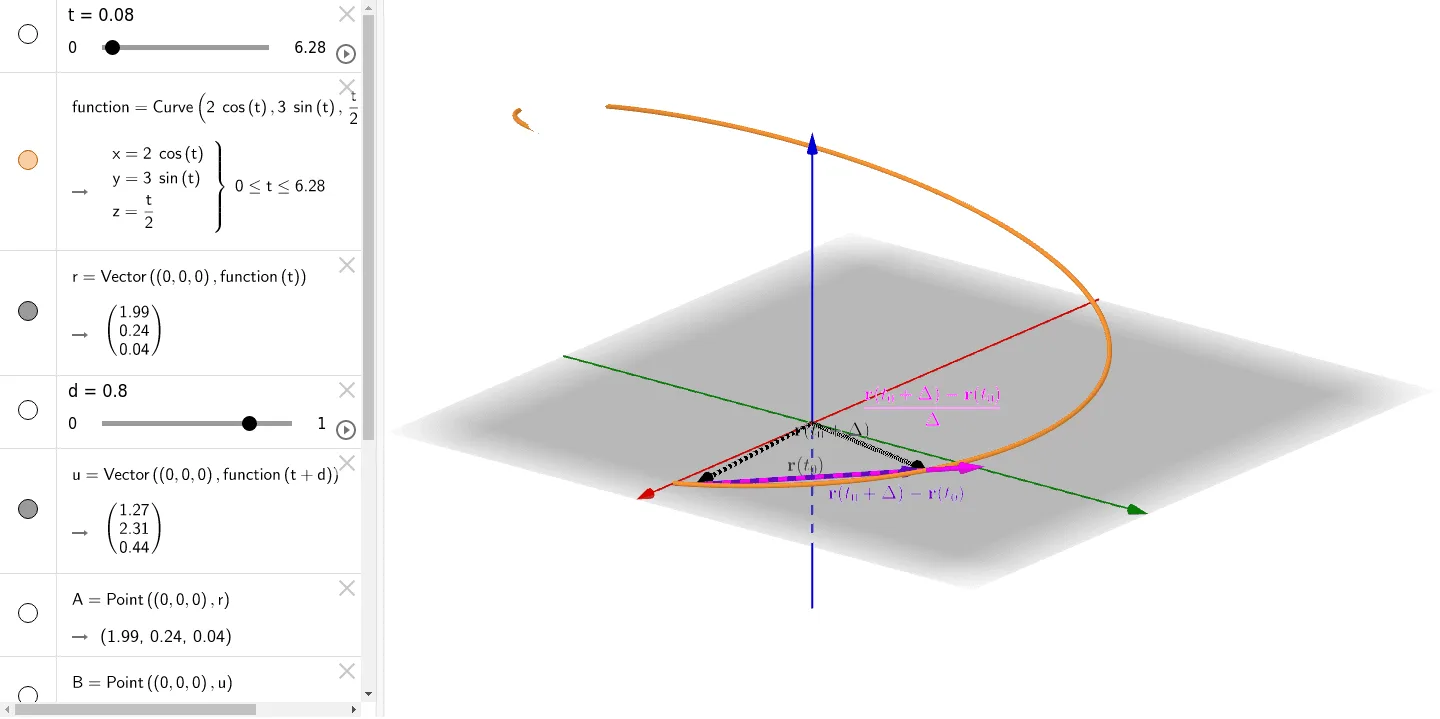
This example demonstrates how to use GeoGebra to plot the derivative of a vector-valued function, showing tangent vectors at various points on a parametric curve. The core mathematical concepts include vector-valued functions, the geometric meaning of derivatives (tangent vectors), and differential geometry of parametric curves. Construction details: Use CurveCartesian to draw the parametric curve r(t), compute its derivative r'(t), use Vector to draw tangent vectors at points on the curve, and Point to mark key points (A, B, C, etc.). This example is suitable for advanced calculus and vector analysis courses, helping students intuitively understand parametric curve tangent vectors, ideal for university mathematics or engineering students.
GeoGebra Commands & Parameters
CurveCartesian((2 * cos(t)), (3 * sin(t)), t / 2, t, 0, (2 * π)) → functionVector((0, 0, 0), function(t)) → rVector((0, 0, 0), function(t + d)) → uPoint((0, 0, 0), r) → APoint((0, 0, 0), u) → BVector(A, B) → vPoint(A, Vector[(1 / d * v)]) → CVector(A, C) → w
AI Drawing Prompt Reference
Plot a parametric curve and visualize its tangent vectors at various points. First, draw the curve defined by a function, then compute its derivative. At multiple points on the curve, draw tangent vectors to show their directions and magnitudes. Mark key positions on the curve with points and use vectors to connect them for visualization.
The prompt above was compiled from the original drawing commands and is for reference only.