
Vector & Function Graph GeoGebra Example
Loading the math board and drawing, please wait…
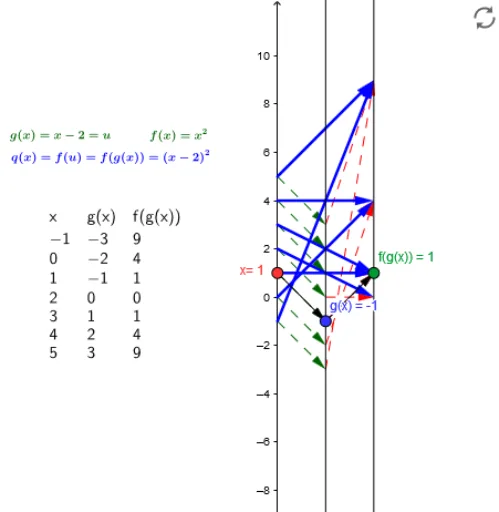
This example demonstrates how to use GeoGebra to plot vectors, function graphs, and scatter plots, along with reflection transformations. Core math concepts include vector operations, function graphing, standard deviation, scatter plot construction, and geometric transformations. Key GeoGebra commands used are Point, Vector, Textfield, Sequence, Zip, TableText to create vectors a, b, functions g, f, and their transformations. Suitable for high school mathematics teaching to understand vectors, function transformations, and data analysis.
GeoGebra Commands & Parameters
Point(yAxis) → AVector(A, B) → uVector(B, C) → vTextfield(g) → inputBox1Textfield(f) → inputBoxfSequence(-1, 5, dx) → NZip(Vector[(2, g(z)), (4, f(g(z)))], z, N) → fgx_*Zip(Vector[(0, z), (2, g(z))], z, N) → g_*Zip((z, g(z)), z, N) → Pg_*Zip((z, f(g(z))), z, N) → Pfg_*Zip(Vector[(0, z), (4, f(g(z)))], z, N) → qx_*TableText(Transpose[{Append["x", N], Append["g(x)", g(N)], Append["f(g(x))", f(g(N))]}]) → Table
AI Drawing Prompt Reference
Draw a coordinate system with vectors u and v, and the graphs of functions g and f. Use inputBox1 and inputBoxf to input the expressions of g and f. Based on the input, plot the graphs of g(x) and f(g(x)), and construct corresponding scatter plots and vectors.
The prompt above was compiled from the original drawing commands and is for reference only.