
Vector Equilibrium (Graphical Addition)
Loading the math board and drawing, please wait…
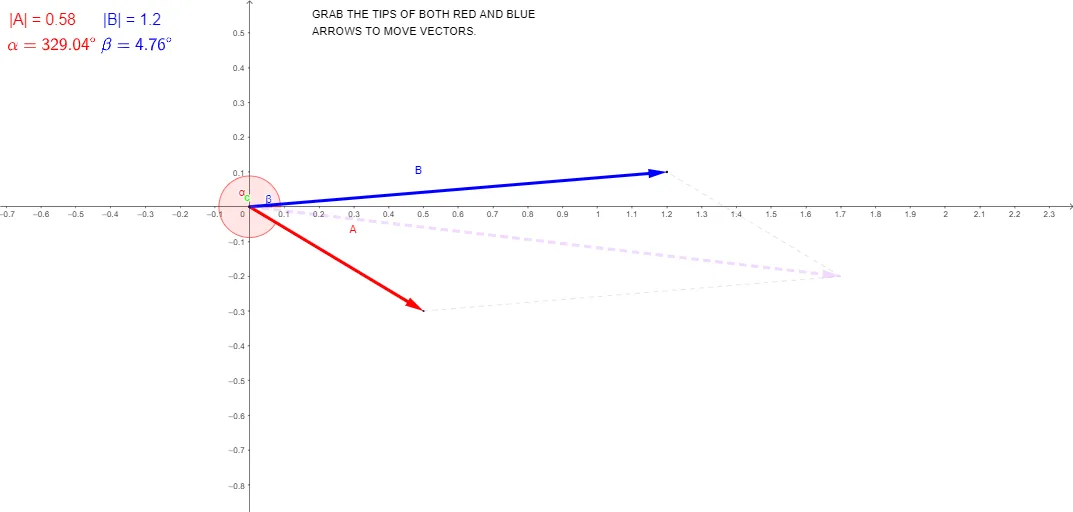
This GeoGebra example dynamically demonstrates the equilibrium state of multiple vectors through graphical addition, visually illustrating vector composition and force balance. Core mathematical concepts include vector addition, equilibrium conditions, angle and segment relationships, and construction of special points. Construction highlights: using GeoGebra commands such as Intersect, Vector, Angle, Segment, and Point, it builds objects like I, C, B, A, u, v, D, w, E, α, β, g, h, F, G, a, θ, H, b, αα, along with multiple text labels (text1 to text6) for annotation. Suitable for high school and above to study vector operations, force equilibrium in physics, and geometric construction with dynamic exploration. By dragging relevant points, learners can observe how the vector sum changes and when equilibrium is achieved, deepening understanding of the geometric meaning of vector addition.
GeoGebra Commands & Parameters
Intersect(xAxis, yAxis) → AVector(A, B) → uVector(A, C) → vVector(A, D) → wAngle(E, A, B) → αAngle(E, A, C) → βSegment(B, D) → gSegment(D, C) → hPoint(w) → FVector(F, G) → aAngle(E, F, G) → θPoint(a) → HVector(H, I) → b
AI Drawing Prompt Reference
Draw a dynamic illustration showing the equilibrium state of multiple vectors through graphical addition, including three vectors originating from the origin, labeled angles between them, and the process of vector addition and subtraction, allowing observation of how the vector sum changes and when equilibrium is achieved by dragging points, constructing special points and segments, and labeling relevant angles and lengths.
The prompt above was compiled from the original drawing commands and is for reference only.