
Variability and MAD: Geometric construction for mean absolute deviation
Loading the math board and drawing, please wait…
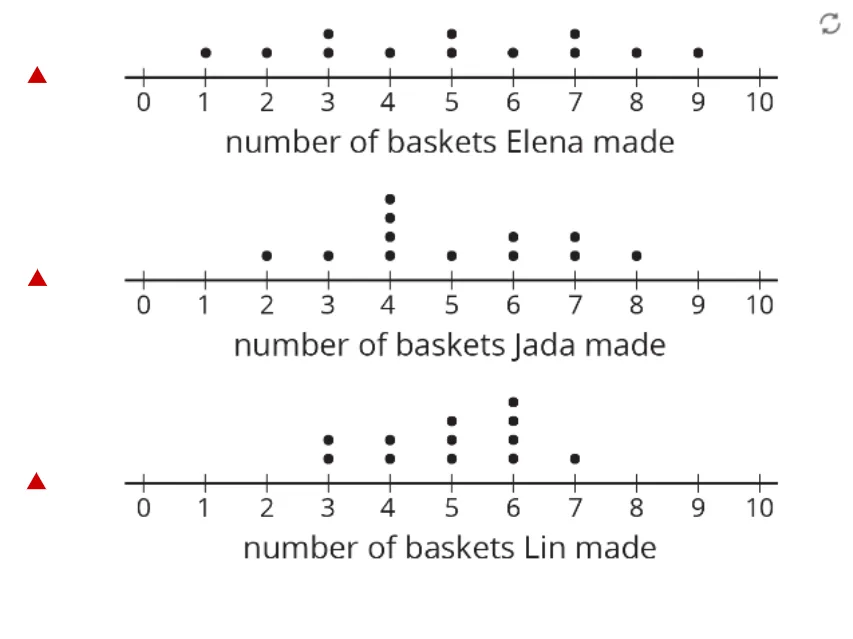
This example demonstrates how to visualize the idea of data variability using a geometric construction centered on the mean absolute deviation (MAD). It highlights how MAD measures dispersion relative to a central reference by averaging absolute deviations. Key concepts include variability (dispersion), the definition and interpretation of MAD, and the role of absolute values when summarizing deviation patterns. In GeoGebra, the construction is driven by creating and positioning key points (Point command; objects such as A, B, C, D, E, F, pic1, a, eq1, f, b, G, H, I), which serve as the geometric anchors for the diagram that makes deviation and its aggregation visually accessible. Suitable for late high school through early university statistics courses and classroom demonstrations linking statistical quantities to geometric intuition.
GeoGebra Commands & Parameters
Point(eq1) → GPoint(b) → HPoint(f) → I
AI Drawing Prompt Reference
Draw a geometric construction to visualize data variability. Include a central point representing the mean, and multiple points around it representing data points. Connect the central point to each data point and calculate the lengths of these lines. Average these lengths to get the root mean square deviation. Ensure the diagram is clear and labels key points like the mean and deviation point.
The prompt above was compiled from the original drawing commands and is for reference only.