
Using a Spreadsheet
Loading the math board and drawing, please wait…
In collections
How to (3): Commands, Spreadsheets and Statistics
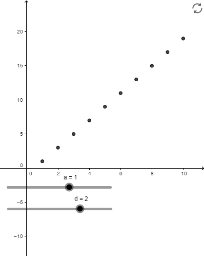
This example demonstrates how to use a spreadsheet for data analysis. It involves key mathematical concepts such as random experiments and normal distribution. By constructing objects like a, d, A1, A2, etc., as described in the construction summary, one can understand how to create and manipulate spreadsheet data in GeoGebra. Suitable for high school and above students or teachers for teaching statistics and probability.
GeoGebra Commands & Parameters
Numeric a(1)Numeric d(2)A1:1A2:2A3:3(2 * A3) - A2(2 * A4) - A3(2 * A5) - A4(2 * A6) - A5(2 * A7) - A6(2 * A8) - A7(2 * A9) - A8aB1 + dB2 + dB3 + dB4 + dB5 + dB6 + dB7 + dB8 + dB9 + d(A1, B1)(A2, B2)(A3, B3)(A4, B4)(A5, B5)(A6, B6)(A7, B7)(A8, B8)(A9, B9)(A10, B10){A, B, C, D, E, F, G, H, I, J}
AI Drawing Prompt Reference
Draw a line graph with 10 points, where the x-coordinates are 1 to 9, and the y-coordinates are 1, 2, 3, 6, 7, 10, 11, 14, 15, 18 respectively. The y-coordinate of each point is calculated by multiplying the y-coordinate of the previous point by 2 and then subtracting the y-coordinate of the point before that. Finally, set the x-coordinate of the 10th point to 10.
The prompt above was compiled from the original drawing commands and is for reference only.