
Unit Circle and Sine Graph by Emily Young
Loading the math board and drawing, please wait…
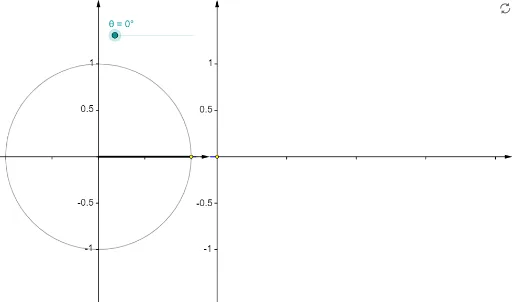
This example demonstrates how to generate the sine graph from the unit circle. It involves core mathematical concepts such as the unit circle, trigonometric functions, and the sine function. Construction highlights the use of GeoGebra commands and objects like Point, Rotate, Angle, Function, Segment, Circle, Vector, and Sequence. Suitable for high school students learning trigonometric functions and analytical geometry.
GeoGebra Commands & Parameters
Point(Ray[(0, 0), (-1, 0)]) → BRotate(A, θ, B) → PRotate(A, θ, B) → A'Angle(A, B, A') → αRotate(A, θ, B) → A'_1Angle(A, B, A'_1) → βFunction(sin((120° * x)), 0, x(Q)) → fSegment(Q, (x(Q), 0)) → eCircle(B, A) → cSegment(B, P) → aVector((x(B), y(Corner[1])), (x(B), y(Corner[4]))) → uVector((0, y(Corner[1])), (0, y(Corner[4]))) → wVector((0, 0), (x(Corner[2]), 0)) → zSequence(Segment[((0.75 * i), 0), ((0.75 * i), -0.025)], i, 1, 4) → list1Segment(P, (x(P), 0)) → bVector(B - (1.2, 0), B + (1.2, 0)) → vSequence(Segment[(0, (0.5 * i) - 1), (-0.025, (0.5 * i) - 1)], i, 0, 4) → list2Sequence(Segment[(x(B), (0.5 * i) - 1), (x(B) - 0.025, (0.5 * i) - 1)], i, 0, 4) → list3Segment(P, Q) → dSequence(Segment[B + ((0.5 * i) - 1, 0), B + ((0.5 * i) - 1, -0.025)], i, 0, 4) → list4Point(Ray[(0, 0), (-1, 0)]) → B_1Rotate(A_1, θ, B_1) → P_1Rotate(A_1, θ, B_1) → A'_2Rotate(A_1, θ, B_1) → A'_3Circle(B_1, A_1) → c_1Segment(B_1, P_1) → a_1
AI Drawing Prompt Reference
Draw a unit circle with its center on the left side of the coordinate plane)Skip. From the center, draw a horizontal ray to the left. Place a moving point on the circle that rotates by an angle parameter. Connect the center to this point with a radius segment, and mark the angle. Drop a perpendicular from the moving point to the horizontal axis. On the right, set up a coordinate system with the horizontal axis representing angle and the vertical axis representing sine. Map the y-coordinate of the moving point to the sine curve, creating a corresponding point. Connect the moving point to this mapped point with a segment to show the generation of the sine graph. Add tick marks on both axes and draw a portion of the sine curve.
The prompt above was compiled from the original drawing commands and is for reference only.