
Unit Circle and Cosine Graph
Loading the math board and drawing, please wait…
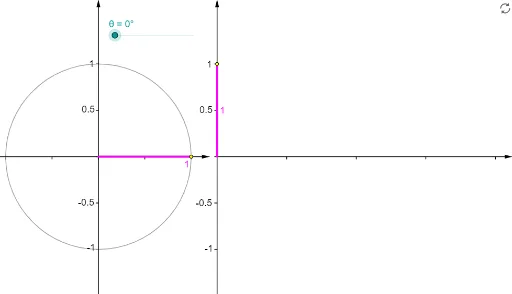
This example demonstrates how to generate the cosine graph using a unit circle. It illustrates the relationship between any point on the unit circle and the cosine function graph. Key math concepts include the unit circle, trigonometric functions, cosine theorem, and coordinate geometry. Construction involves commands/objects like Point, Rotate, Angle, Segment, Circle, Vector, Sequence, and Function in GeoGebra. Suitable for high school mathematics teaching and learning the plotting of trigonometric function graphs.
GeoGebra Commands & Parameters
Point(Ray[(0, 0), (-1, 0)]) → BRotate(A, θ, B) → PRotate(A, θ, B) → A'Angle(A, B, A') → αRotate(A, θ, B) → A'_1Angle(A, B, A'_1) → βSegment(Q, (x(Q), 0)) → eSegment((0, 0), (x(Q), 0)) → gCircle(B, A) → cSegment(B, P) → aVector((x(B), y(Corner[1])), (x(B), y(Corner[4]))) → uVector((0, y(Corner[1])), (0, y(Corner[4]))) → wVector((0, 0), (x(Corner[2]), 0)) → zSequence(Segment[((0.75 * i), 0), ((0.75 * i), -0.025)], i, 1, 4) → list1Segment(B, (x(P), 0)) → bSegment(P, (x(P), 0)) → hFunction(cos((120° * x)), 0, x(Q)) → fVector(B - (1.2, 0), B + (1.2, 0)) → vSequence(Segment[(0, (0.5 * i) - 1), (-0.025, (0.5 * i) - 1)], i, 0, 4) → list2Sequence(Segment[(x(B), (0.5 * i) - 1), (x(B) - 0.025, (0.5 * i) - 1)], i, 0, 4) → list3Sequence(Segment[B + ((0.5 * i) - 1, 0), B + ((0.5 * i) - 1, -0.025)], i, 0, 4) → list4Segment(Q, (0, y(Q))) → dPoint(Ray[(0, 0), (-1, 0)]) → B_1Rotate(A_1, θ, B_1) → P_1Rotate(A_1, θ, B_1) → A'_2Rotate(A_1, θ, B_1) → A'_3Circle(B_1, A_1) → c_1Segment(B_1, P_1) → a_1
AI Drawing Prompt Reference
Draw a unit circle and the cosine function graph. First, draw a unit circle centered at the origin. Then, rotate a point P on the unit circle around the origin to form angle α. Draw a perpendicular segment from P to the x-axis and a line segment from the origin to P. Next, draw a projection point Q of P on the x-axis, and draw a line segment from Q to the origin. Then, draw a horizontal line segment from the origin to Q, a vertical line segment from the origin to Q, and a perpendicular segment from Q to the x-axis. Finally, draw the cosine function graph from 0 to x(Q).
The prompt above was compiled from the original drawing commands and is for reference only.