
Unit Circle and Graph of Cosine
Loading the math board and drawing, please wait…
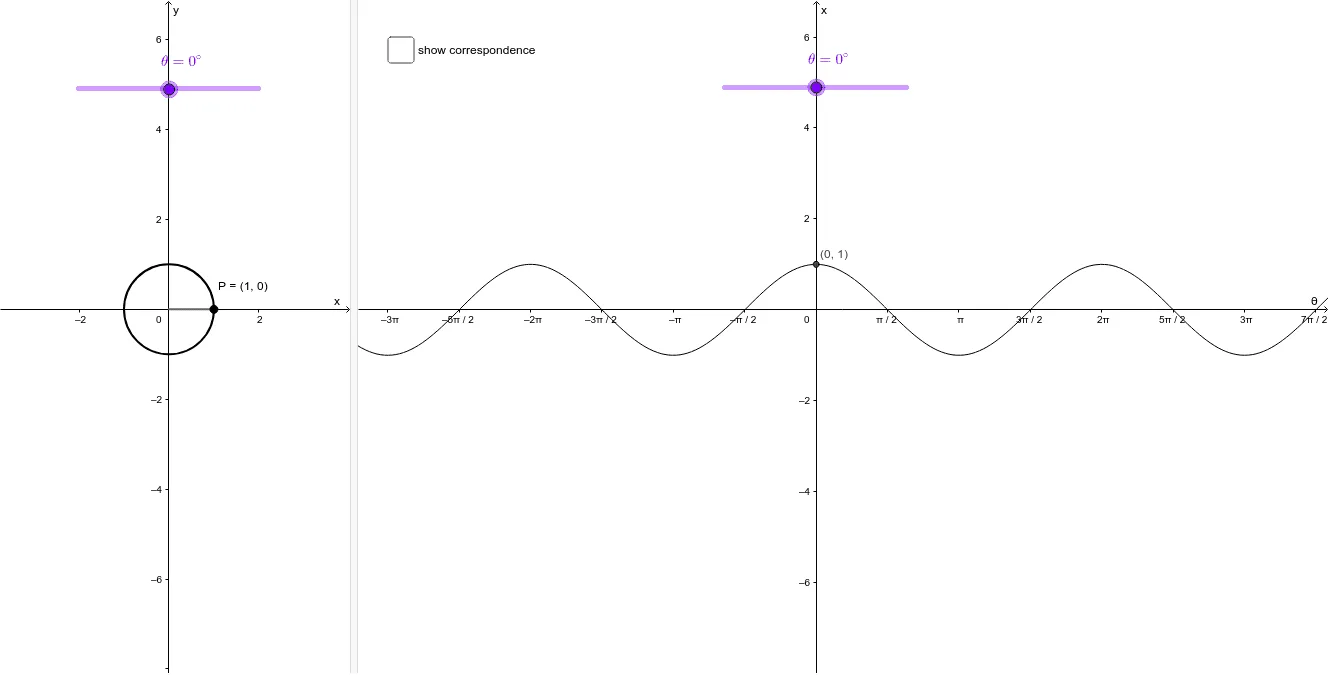
This example demonstrates the relationship between the unit circle and the cosine function graph. By plotting points on the unit circle and showing their x-coordinates corresponding to the cosine function graph, it helps understand the definition and properties of the cosine function. GeoGebra commands and objects like Intersect, Point, Circle, CurveCartesian, and Segment are used in the construction, suitable for high school students learning trigonometry and analytical geometry.
GeoGebra Commands & Parameters
Intersect(xAxis, yAxis) → APoint(xAxis) → BCircle(A, B) → cCurveCartesian(((t / 70 + 0.07) * cos(t)), ((t / 70 + 0.07) * sin(t)), t, 0, (ang * π / 180)) → bCurveCartesian(((abs(t) / 70 + 0.07) * cos(t)), ((abs(t) / 70 + 0.07) * sin(t)), t, (ang * π / 180), 0) → b_1Segment(A, P) → aSegment(C, D) → dIntersect(ang, yAxis, 1) → ESegment(P, F) → e
AI Drawing Prompt Reference
Draw a unit circle and plot points on it to show their x-coordinates corresponding to the cosine function graph. First, draw the intersection point A of the x-axis and y-axis, then take point B on the x-axis and draw circle c with A and B as diameter. Next, draw the graph of the cosine function b with parameters ((t / 70 + 0.07) * cos(t)), ((t / 70 + 0.07) * sin(t)) from t=0 to t=ang * π / 180. Then, draw the graph of the absolute value cosine function b_1 with parameters ((abs(t) / 70 + 0.07) * cos(t)), ((abs(t) / 70 + 0.07) * sin(t)) from t=ang * π / 180 to t=0. Finally, draw line segments a from A to point P on the circle, d from point C to point D on the circle, and e from point P to point F.
The prompt above was compiled from the original drawing commands and is for reference only.