
Unit Circle and Sine Function by Kevin Weaver
Loading the math board and drawing, please wait…
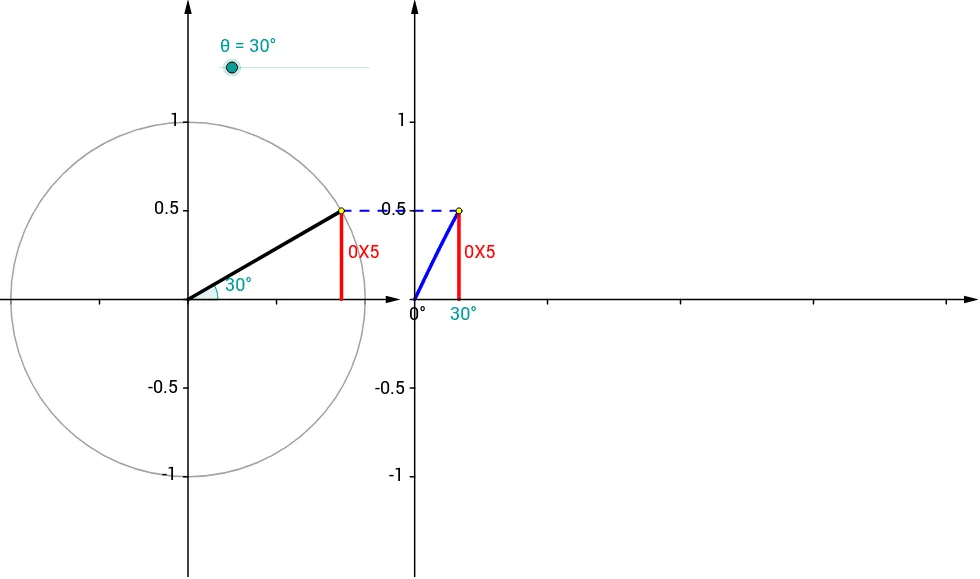
This example dynamically demonstrates the relationship between a point on the unit circle and the sine function graph, visually showing the generation process of the sine function. Core mathematical concepts include the unit circle, trigonometric functions, coordinate geometry, and function graphs. Key construction elements involve GeoGebra commands and objects such as Point, Rotate, Angle, Function, and Vector, with slider animations illustrating the point's motion trajectory and the formation of the sine wave. Suitable for high school students learning trigonometric functions and analytical geometry to deepen their understanding of the connection between function graphs and geometric figures.
GeoGebra Commands & Parameters
Point(Ray[(0, 0), (-1, 0)]) → BRotate(A, θ, B) → PRotate(A, θ, B) → A'Angle(A, B, A') → αRotate(A, θ, B) → A'_1Angle(A, B, A'_1) → βFunction(sin(120° * x), 0, x(Q)) → fSegment(Q, (x(Q), 0)) → eCircle(B, A) → cSegment(B, P) → aVector((x(B), y(Corner[1])), (x(B), y(Corner[4]))) → uVector((0, y(Corner[1])), (0, y(Corner[4]))) → wVector((0, 0), (x(Corner[2]), 0)) → zSequence(Segment[(0.75 * i, 0), (0.75 * i, -0.025)], i, 1, 4) → list1Segment(P, (x(P), 0)) → bVector(B - (1.2, 0), B + (1.2, 0)) → vSequence(Segment[(0, 0.5 * i - 1), (-0.025, 0.5 * i - 1)], i, 0, 4) → list2Sequence(Segment[(x(B), 0.5 * i - 1), (x(B) - 0.025, 0.5 * i - 1)], i, 0, 4) → list3Segment(P, Q) → dSequence(Segment[B + (0.5 * i - 1, 0), B + (0.5 * i - 1, -0.025)], i, 0, 4) → list4Point(Ray[(0, 0), (-1, 0)]) → B_1Rotate(A_1, θ, B_1) → P_1Rotate(A_1, θ, B_1) → A'_2Rotate(A_1, θ, B_1) → A'_3Circle(B_1, A_1) → c_1Segment(B_1, P_1) → a_1
AI Drawing Prompt Reference
Draw a unit circle centered at the origin and show a point moving along the circle's circumference as an angle changes. Simultaneously, plot the sine function graph corresponding to the point's vertical coordinate. Use animation to dynamically demonstrate how the point's position on the circle generates the sine wave, highlighting the relationship between trigonometric functions and coordinate geometry. Include key geometric elements like angles and vectors for clarity.
The prompt above was compiled from the original drawing commands and is for reference only.